
How high can ENA go after breaking above $0.12 on heavy volume?

AI Sentiment: 78/100 Bullish
This score is generated through AI-driven analysis of the article's content.

powered by

Buy ENA. The $0.12 breakout came on heavy volume and followed a month-long range break, and the new $1B FalconX lending facility adds a credible, non-basis return stream for USDe/ENA. Momentum is still constructive while ENA holds above the cleared $0.115 area; upside is a clean path to the 200-day EMA (~$0.1268) and then $0.1366 (2.618 fib).
Key Risk: A fast momentum fade: ENA loses $0.115 and falls back into the prior range, showing the breakout was just a short-lived squeeze.
Sell ENA perps (or buy ENA puts) to protect against a pullback. The 4-hour RSI is ~91 and price is outside the upper Bollinger Band, which usually means mean reversion risk even if the longer-term story is intact. Use this to monetize volatility while the market digests the news and tests support near $0.115–$0.116.
Key Risk: Buyers keep pressing and ENA closes above the 200-day EMA (~$0.1268), turning the overbought setup into a trend continuation.
- ENA has jumped more than 34% in 24 hours.
- A $1 billion FalconX financing facility has supported the rally.
- ENA is now testing the 200-day EMA near $0.1268.
Ethena's price has jumped more than 34% over the past 24 hours to around $0.125, extending its seven-day gain to more than 46% as traders respond to a new $1 billion institutional lending facility and a breakout from a month-long price range.
CoinGecko data showed ENA trading near $0.125 on Aug. 21 after rising from around $0.093 over the previous day, while the token's trading activity increased sharply during the move.
The rally ensued after FalconX's Aug. 19 announcement of a $1 billion secured warehouse financing facility with Ethena, under which assets backing USDe can be deployed into overcollateralised loans to institutional borrowers.
FalconX said it will originate and service the loans while collateral is held with qualified third-party custodians.
Ethena receives exposure to the loans through a special purpose vehicle, with the structure designed to provide secured institutional credit using capital from assets backing USDe.
For Ethena, the arrangement adds another source of returns alongside the crypto basis strategies historically used by USDe.
FalconX said the facility provides access to overcollateralised institutional lending and a return stream outside traditional crypto basis trades.
USDe has relied partly on delta-neutral strategies involving spot crypto positions and short derivatives positions.
Returns from such strategies can change as perpetual futures funding rates move, making the new lending channel another way for Ethena to deploy reserve assets.
The timing of ENA's move is also notable. The FalconX deal was announced on Aug. 19, when ENA remained near the low-$0.09 range, while the strongest part of the rally came over the following two days.
CoinGecko's intraday chart showed ENA breaking above $0.10 and continuing through $0.11 and $0.12 as trading activity increased.
Rather than an immediate one-candle reaction to the announcement, the price move accelerated after ENA cleared the range that had contained it for much of August.
ENA's rally has also been helped by strength across the crypto market.
Bitcoin returned above $75,000 after the US Treasury decided to double purchases of older long-dated government bonds, while renewed attention on US crypto legislation also supported sentiment.
ENA's breakout therefore came as buying returned across major crypto assets, adding momentum to its token-specific catalysts.
ENA price analysis
The 4-hour ENA/USDT TradingView chart shows momentum at an unusually high level after the breakout.
See below:
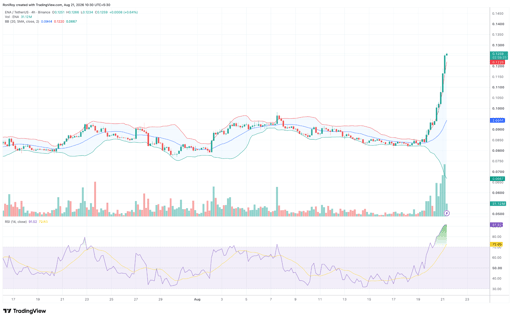
ENA/USDT 4-hour price chart. Source: TradingView.
ENA was trading near $0.126 at the time of the chart, compared with a Bollinger Band upper boundary of around $0.122 and a 20-period middle band near $0.0944.
Price trading above the upper Bollinger Band confirms how quickly ENA has moved away from its recent range, while the widening bands show volatility expanding alongside the rally.
The same chart recorded a sharp increase in volume as ENA moved through $0.10, giving the breakout stronger participation than the trading seen during the preceding consolidation.
At the same time, the 4-hour Relative Strength Index had climbed to 91.5, well above the 70 level commonly used to identify overbought conditions. Its RSI moving average stood near 72.8.
Although the readings show strong momentum, they also leave ENA vulnerable to a short-term pullback or sideways period if buyers fail to maintain the current pace.
On the daily chart, ENA has moved above its 20-day EMA at $0.0928, 50-day EMA at $0.0889, and 100-day EMA at $0.0931.
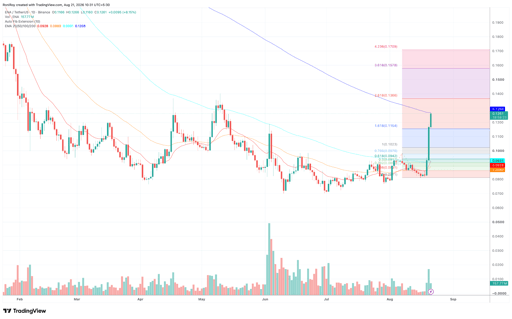
ENA/USDT 1-day price chart. Source: TradingView.
The next resistance sits almost directly above the current price, with the 200-day EMA around $0.1268.
A daily close above the $0.1268 area would put ENA above all four moving averages shown on the chart and could open the next Fibonacci extension levels.
The daily Fibonacci extension places the 2.618 level at $0.1366, making the 0.136-0.137 area the first upside target if ENA clears the 200-day EMA.
Above it, the 3.618 extension at $0.1578 provides a second target, while an extended rally would bring the 4.236 level near $0.1709 into view.
The same Fibonacci structure places the 1.618 extension at $0.1154, a level ENA has already crossed.
If the breakout loses momentum, 0.115-0.116 could therefore become the first area to watch on a retracement, followed by the previous breakout region around 0.102-0.098.
With the 4-hour RSI already above 90 and price outside the upper Bollinger Band, ENA remains stretched in the short term.
A move towards $0.1366 would likely require the token to hold above the recently cleared $0.115 area and secure a daily break above the 200-day EMA at $0.1268.

XRP breaks out as whales scoop 300M tokens: can bulls force a move to $1.50?

Bitcoin rockets past $74K but one warning sign could derail the push to $80K

Bitcoin dubbed 'one of the best hedges you can find' - again

Bitcoin breaches $72K: why BTC is surging 6% even as Wall Street stumbles

BMNR stock jumps as Ethereum rebounds, BitMine nears inflection point
No results found
Loading articles...
Failed to load articles. Please try again.