
Bitcoin price rises, but why is $80K proving so hard to break?

AI Sentiment: 35/100 Bearish
This score is generated through AI-driven analysis of the article's content.

powered by

Buy BTC if it reclaims $80,000 and holds above $80,000 for a full 4-hour close; target $81,000–$82,000 first, then $83,300 and $86,000. Rationale: ETF inflows are still supporting, price is above key daily moving averages, and the $80,000 ceiling looks supply/positioning-driven rather than trend broken. Key risk: ETF inflows flip to sustained outflows and macro rates keep rising, turning the $80,000 reclaim into a failed breakout.
Key Risk: ETF outflows resume and rates keep climbing, causing a failed $80,000 breakout.
Sell BTC (or buy BTC puts) on a rejection at $81,000–$82,000, targeting $77,300 then $74,500. Rationale: overhead supply is concentrated $81,000–$86,000 (long-term holders + self-custody pocket near $80,800) and options/hedging resistance sits around $82,300; leverage has cooled after the squeeze, so rallies lack fuel. Key risk: sustained move above $83,300 with continued ETF inflows that proves buyers are absorbing the supply.
Key Risk: BTC breaks and holds above $83,300 with ETF inflows, absorbing the overhead supply.
- Bitcoin price remains stuck below $80,000.
- Heavy supply between $81,000 and $86,000 continues to limit gains.
- BTC remains above key daily EMAs, but momentum has weakened.
Bitcoin price has risen roughly 1% over the past 24 hours to $78,700, but has remained below $80,000 as fresh institutional demand meets profit taking and a heavy supply zone above current levels.
Strategy's latest filing with the US Securities and Exchange Commission disclosed a purchase of 4,603 BTC for $369.7 million between Aug. 24 and Aug. 30, bringing its total holdings to 845,050 BTC.
The company paid an average $80,318 per coin for the latest purchase, putting its entry price above Bitcoin's current market price.
The purchase was Strategy's first in roughly 10 weeks and returned one of Bitcoin's largest corporate holders to the market after a pause in accumulation.
Its total Bitcoin position was acquired for $63.73 billion at an average $75,412 per BTC, according to the filing.
Bitcoin has still struggled to turn renewed demand into a move above $80,000.
BTC briefly reached roughly $81,455 during its August recovery, but repeated attempts to stay above $80,000 have met selling, leaving the cryptocurrency back around $78,700 on Sept. 1.
Institutional buying had provided support before the latest rejection.
According to Glassnode, US spot Bitcoin ETFs attracted more than $2.8 billion during eight consecutive sessions as BTC recovered in August, while Bitcoin also moved away from exchanges as wallets of different sizes accumulated.
ETF demand weakened at the end of the month. US spot Bitcoin ETFs recorded $201.9 million in net outflows on Aug. 28, ending a nine-session streak that had brought in $3.04 billion.
Supply above $80,000 helps explain why those inflows have not produced a sustained breakout.
Glassnode identified $81,000 to $86,000 as a concentration of several overhead structures, including long-term holders close to their cost basis and a heavy pocket of coins held in self-custody beginning near $80,800.
Options positioning adds resistance inside the same area. Glassnode placed a change in dealer hedging behaviour around $82,300, while short liquidation levels remain concentrated between $82,000 and $86,000.
The firm identified a sustained move above $83,300, supported by continued ETF inflows, as evidence that buyers are absorbing the supply.
Leverage has fallen at the same time. Futures open interest dropped 11% in Bitcoin terms during the August short squeeze, while perpetual funding remained largely neutral, according to Glassnode.
The firm found that fresh leveraged longs did not replace the positions removed during the squeeze.
Bitcoin also enters September after gaining roughly 24% over the past 30 days, leaving traders with sizeable profits following the August recovery.
BTC has historically averaged a decline during September, although past seasonal performance does not determine how the asset will trade this month.
Macroeconomic pressure has made a break above $80,000 harder as well.
Federal Reserve Chair Kevin Warsh's hawkish Jackson Hole speech pushed market expectations sharply towards another rate increase, with Reuters reporting on Aug. 31 that traders saw a more than 65% probability of a September hike.
Warsh warned that policymakers would need to act if inflation failed to move towards the Fed's 2% target.
Barclays subsequently changed its forecast to two more 25-basis-point increases this year, one in September and another in December, after previously expecting no further hikes in 2026.
Oil prices have added to inflation concerns as fighting between the US and Iran pushed crude higher, while Treasury yields rose after Warsh's comments.
Bitcoin fell below $78,000 following the Jackson Hole speech as the two-year Treasury yield climbed 12 basis points to 4.35%.
The next US employment figures will give markets another reading on the economy before the Fed's Sept. 16 decision.
The August consumer price index, due Sept. 11, will provide another major inflation reading before policymakers meet.
BTC price analysis
Bitcoin's daily chart still favours the August breakout despite the repeated failures at $80,000.
BTC at $78,719 is trading above the 20-day EMA at $74,475, the 200-day EMA at $72,294, the 50-day EMA at $70,027 and the 100-day EMA at $69,053.
See below:
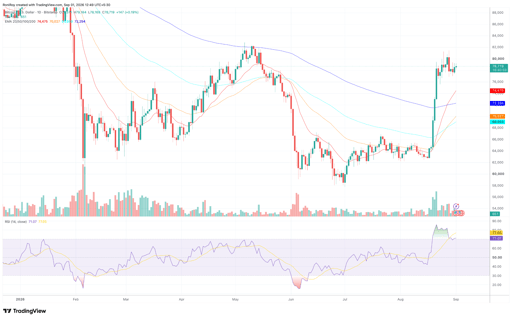
BTC/USD 1-day price chart. Source: TradingView.
The 20-day EMA has turned sharply higher following the August price surge and now provides the nearest dynamic support.
BTC could therefore absorb a pullback towards $74,500 without immediately losing the structure created by its move from the $63,000-$65,000 area.
Price has also remained several thousand dollars above the 200-day EMA at $72,294.
A decline through the 20-day EMA would put the 200-day EMA in focus next, followed by the $69,000-$70,000 region where the 50-day and 100-day averages are closely grouped.
Daily RSI has moved in the opposite direction to price over the past several sessions.
The indicator has fallen to 71.07 after climbing above 80 during the August surge, while its moving average remains higher at 77.05.
BTC is therefore still marginally in overbought territory, but the drop in RSI while price holds near $79,000 shows that the momentum behind the initial move has eased.
A further decline below 70 in the RSI while BTC remains under $80,000 would strengthen the case for more consolidation.
Holding near 70 while price clears the recent highs would instead allow momentum to rebuild without returning immediately to the extreme readings seen during the first leg higher.
On the 4-hour chart, Bitcoin is trading above the Bollinger Band midpoint at $78,216 and below the upper band at $79,089.
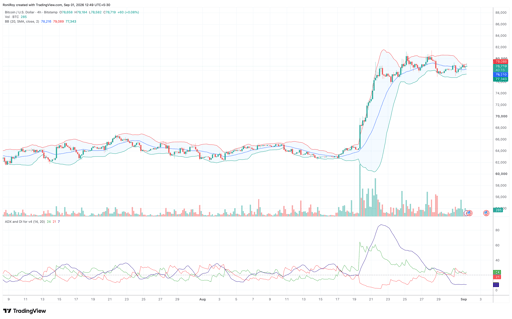
BTC/USD 4-hour price chart. Source: TradingView.
The lower band sits at $77,343, putting most of the latest price action inside a range of less than $2,000.
The bands have contracted considerably after expanding during Bitcoin's sharp move from the mid-$60,000s.
A 4-hour move above the $79,089 upper band would put $80,000 back in play, followed by the recent $81,000-$82,000 highs.
Clearing that area would expose the $83,300 level identified by Glassnode and then the remaining supply towards $86,000.
A move below the Bollinger midpoint at $78,216 would instead return BTC towards the lower band at $77,343.
Losing $77,300 on a sustained basis would leave the daily 20-day EMA around $74,475 as the next major dynamic support.
At the same time, the 4-hour ADX has dropped to 7, down sharply from readings above 80 during the August breakout.
Such a low reading shows that the current price range has little directional strength, consistent with BTC repeatedly moving between roughly $77,000 and $80,000 without extending in either direction.
The Directional Movement Index remains narrowly positive, with +DI at 24 and -DI at 21.
Buyers still have a slight edge, with +DI at 24 against -DI at 21, but an ADX reading of just 7 shows there is little strength behind the move.
Bitcoin would need to push through $79,100 and then $80,000 before the recent sideways trading starts to give way.
If -DI crosses decisively above +DI while BTC loses the $77,343 lower Bollinger Band, the 4-hour structure would instead favour a move towards $74,500, where the rising daily 20-day EMA currently provides the closest major support.

HYPE price near all-time high: could Hyperliquid's US entry spark $100?

Strategy (MSTR) stock gains after resuming Bitcoin purchases after 10 weeks

Ethereum price holds near $2,450 despite Fed pressure: Is $2,500 next?

Why is Bitcoin price down today?

PURR stock price forecast as Hyperliquid’s HYPE token hits a record high
No results found
Loading articles...
Failed to load articles. Please try again.