
Is Ethereum price at risk of losing $2,400 as oil tops $105?

AI Sentiment: 28/100 Bearish
This score is generated through AI-driven analysis of the article's content.

powered by

Despite the selloff, US spot Ethereum ETF flows are still positive (net inflows cited), meaning institutional demand is absorbing supply. Buy ETHA/ETHB on dips toward $2,400–$2,405, targeting a rebound back above $2,450–$2,460 as ETF buyers step in when price weakens. This is a cleaner way to express “ETF demand beats macro” than trading pure crypto beta.
Key Risk: ETF inflows flip negative (outflows accelerate) and price breaks $2,350–$2,360, overwhelming ETF support.
Oil >$105 and 10Y yields near 4.9% are pressuring risk assets; ETH already failed to hold $2,450 and is threatening $2,400 support. Sell ETH now with a focus on a daily close below $2,400, targeting $2,350–$2,360 next, then $2,300 if that breaks. This aligns with weakening accumulation (Chaikin oscillator below zero) and bearish short-term momentum (TRIX rollover).
Key Risk: Oil and Treasury yields reverse quickly, and ETH reclaims $2,450–$2,460 with a daily close back above $2,400.
- ETH has fallen nearly 4% after reversing from above $2,500 to around $2,420.
- Oil above $105 has pressured crypto and other risk assets.
- ETH is testing $2,400 support, with $2,350 to $2,360 next if it breaks lower.
Ethereum price has fallen nearly 4% over the past 24 hours to around $2,420, putting the $2,400 level at risk after oil climbed above $105 and US Treasury yields rose sharply.
CoinGecko puts ETH at roughly $2,419 at the time of writing, down 3.9% over the past day after the token traded as high as roughly $2,512 earlier on Sept. 10.
The reversal erased its intraday gains and left ETH only slightly higher over the past seven days.
Selling accelerated late in the session, taking Ether below $2,450 and as low as roughly $2,405 before buyers pushed the price back towards $2,420.
Oil prices have been a key source of pressure on crypto and other risk assets.
Brent crude rose above $105 a barrel while the WTI surged above $100 on Sept. 10 as Middle East tensions fuelled concerns over energy supplies and inflation, while US equity futures fell. The US 10-year Treasury yield climbed towards 4.9%.
Higher oil prices can keep inflation elevated by increasing energy and transport costs, while rising Treasury yields raise the return available from government debt.
Bitcoin and Ether came under selling pressure as those conditions weighed on risk assets.
The decline came despite fresh demand for US spot Ethereum exchange-traded funds.
Preliminary Sept. 10 figures put net inflows at roughly $34.75 million, including $22.94 million for BlackRock's staking-focused ETHB and $9.71 million for ETHA.
Flows had already turned positive on Sept. 9 with roughly $2.1 million in net inflows, following a $24.29 million withdrawal on Sept. 8.
The latest outflow was small compared with the buying seen in previous weeks, when the funds attracted roughly $824.4 million from Aug. 24 to Aug. 28 and another $218 million the following week.
Available ETH on exchanges has fallen during 2026 while ETF holdings and staking have absorbed part of the circulating supply.
However, Wednesday's price action showed that fresh ETF buying was not enough to prevent ETH from falling as oil and bond yields rose.
The decline followed a strong run for Ether, which had gained roughly 37% in 10 days and reached $2,564 before moving sideways.
ETH price analysis
ETH was trading near $2,428 on the daily chart after falling from an intraday high of $2,468 and reaching roughly $2,406.
Despite the latest drop, price remains above the 20-day, 50-day, 100-day, and 200-day exponential moving averages.
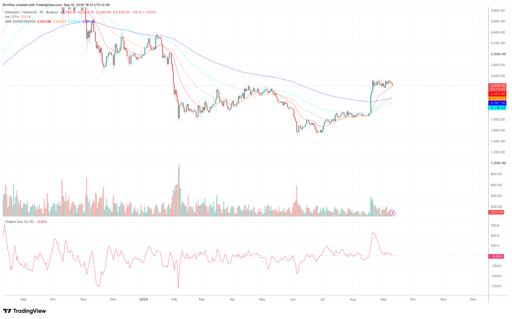
The 20-day EMA sits closest to price at $2,404, making the $2,400-$2,405 area the first support to watch.
The 50-day EMA is considerably lower at $2,222, while the 100-day and 200-day EMAs stand near $2,116 and $2,191, respectively.
Holding the 20-day EMA would keep ETH above the moving-average support that has followed the August breakout.
A daily close below $2,400 would leave the $2,350-$2,360 area as the next support, matching the lower boundary of the bull-flag structure.
Losing that area could expose $2,300 and then the 50-day EMA around $2,222.
The daily Chaikin Oscillator has fallen to roughly -9,890, after surging above 500,000 during the August breakout.
Its move below zero shows that accumulation has weakened as ETH retreats from the $2,500 area.
A return above zero alongside a recovery in price would provide stronger evidence that buyers are returning.
Shorter-term readings remain weaker. On the 4-hour chart, ETH has dropped from the $2,500-$2,550 range, and the latest candle reached approximately $2,405 before recovering towards $2,427.
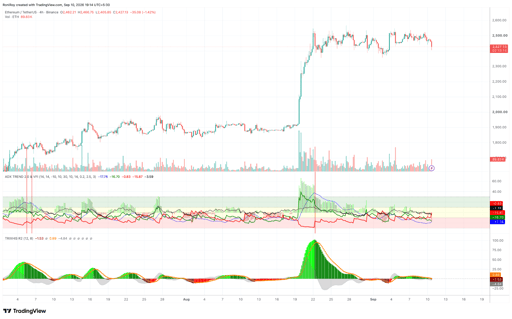
The 4-hour ADX Trend and VFI indicators have deteriorated as price has fallen.
Its directional readings favour sellers, while the subdued trend-strength reading shows that the latest decline has not yet developed into the type of strong directional move recorded during the August breakout.
A break below $2,400 accompanied by rising ADX would strengthen the case for a move towards $2,350-$2,360.
The TRIX R2 has rolled over after a modest positive cycle and moved below its signal line.
TRIX is around -1.53, compared with its signal near 0.89, while the histogram has slipped to roughly -4.84.
The crossover confirms that short-term momentum has turned bearish as ETH loses the $2,450 area.
Liquidation positioning puts several important levels around the current price.
Binance's 24-hour ETH/USDT liquidation heatmap shows that the fall through roughly $2,450-$2,440 was followed by a quick move towards $2,405, clearing leveraged positions along the way.
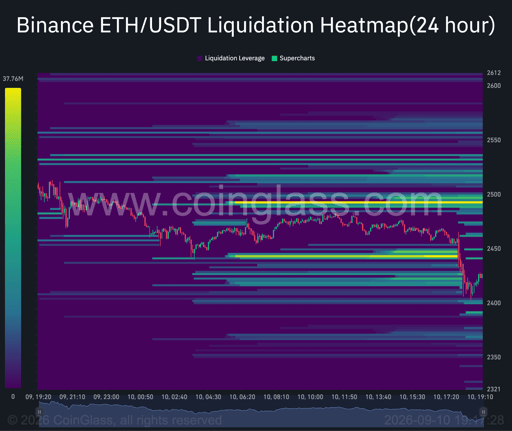
Liquidity remains concentrated around $2,400, with another cluster immediately above current prices.
A break below $2,400 could take ETH towards the $2,350-$2,360 support area identified on the daily structure.
The largest untouched liquidation concentration sits higher, around $2,490-$2,500, with further liquidity between roughly $2,520 and $2,560.
If ETH holds $2,400 and recovers above $2,450-$2,460, those clusters put $2,500 and then the recent $2,550-$2,564 highs back in range.
With ETH swinging sharply around key levels, some holders are moving funds into crypto wallets to manage risk outside of exchange order books.

Cardano slides 3% as futures volume declines to $652M

Bitcoin is flashing a warning near $78,000: is the market missing it?

Ethereum falls below $2,500: is this pullback setting up the next ETH surge?

Solana price at risk of falling below $100 as bearish momentum builds

XRP price prediction amid RLUSD stablecoin and ETF tailwinds
No results found
Loading articles...
Failed to load articles. Please try again.