ONDO bulls eye $0.50 breakout following massive weekly rally

AI Sentiment: 72/100 Bullish
This score is generated through AI-driven analysis of the article's content.
powered by
Buy ONDO (ONDO/USD). The news (first tokenized Treasury bill settlement with J.P. Morgan, Mastercard, Ripple) is driving real demand, and the chart is set up for continuation: price above the 200-day EMA ($0.4022), MACD bullish, and a clear trigger—daily close above $0.4524 to open a push through $0.50 toward ~$0.5625.
Key Risk: A daily close back below the 200-day EMA ($0.4022), signaling the breakout failed and momentum is reversing.
Sell/short ONDO (ONDO/USD) only if it fails at the $0.50 level. The article flags overbought risk (RSI ~66) and weakening retail confidence while leverage positioning is building—perfect conditions for a sharp mean-reversion if bulls can’t hold the psychological $0.50 breakout.
Key Risk: ONDO holds above $0.50 and keeps making higher highs, proving the breakout is real and shorts get squeezed.
- ONDO is up 5% on Monday, extending its rebound from the 200-day EMA.
- Derivatives data suggest that retail traders are showing signs of exhaustion.
- The bulls could target the $0.50 psychological level if the rally persists.
The cryptocurrency market is currently experiencing a mixed performance, with some major coins in the red, while others are rallying.
ONDO, the native coin of the Ondo Finance ecosystem, is one of the best performers among the top 50 cryptocurrencies by market cap.
The coin is up by 5% on Monday, having gained more than 8% earlier in the Asian session after last week’s roughly 50% rally.
The rally comes following the recent announcement of the first-ever tokenized Treasury bill settlement.
However, retail confidence shows early signs of weakness as funding rates turn negative.
The momentum indicators remain largely bullish, suggesting that ONDO could experience a breakout rally exceeding $0.50.
ONDO rallies despite declining retail strength
ONDO is up 5% in the last 24 hours and is now trading at $0.4267 per coin.
The positive performance comes after Ondo rallied roughly 50% last week, driven by the first-ever tokenized settlement of a short-term US Treasury bill in partnership with J.P. Morgan, Mastercard, and Ripple.
However, retail confidence in ONDO is declining and this could result in a correction in the near term.
CoinGlass data shows the ONDO futures Open Interest is up 5% over the last 24 hours, reaching $213.77 million, implying steady positional buildup in the leverage market.
Despite that, the funding rate has flipped negative to -0.0065%, suggesting that traders are willing to pay a premium to hold short positions.
Hence, retail traders are anticipating a potential reversal.
Furthermore, ONDO’s long-to-short ratio of 0.9497 suggests a larger number of active short positions. Finally,
ONDO price forecast: Will the bulls push above $0.50?
Unlike other major cryptocurrencies, the ONDO/USD 4-hour chart is bullish thanks to its rally in recent days.
ONDO is trading at $0.4267, well above its 200-day EMA at $0.4022, with the 100-day EMA at $0.3103 and the 50-day EMA at $0.2993 trailing far below and preparing for a Golden Cross.
Momentum indicators remain bullish but could be showing overbought signs.
The Moving Average Convergence Divergence (MACD) rallies above the signal line on the 4-hour chart.
The Relative Strength Index (RSI) around 66 signals bullish conditions that could encourage consolidation or a corrective pause.
If the bulls push higher and close the daily candle above the $0.4524 resistance level, last tested on January 7, ONDO could extend its rally above the $0.5000 psychological level, targeting the $0.5625 level, last seen on November 17.
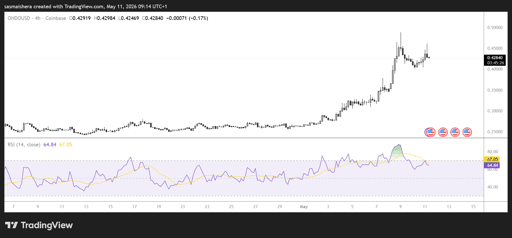
However, if the bears regain control, initial support would be encountered at the 200-day EMA near $0.4022, where a pullback could test the durability of the latest breakout.
A break below this support would expose the next demand area around the 100-day EMA at $0.3103, followed by the 50-day EMA at $0.2993.
Hitting this level would result in the where the broader bullish structure coming under pressure.

Injective price forecast: Coinbase integration strengthens bullish case for INJ

Bitcoin price outlook: treasury sell-offs, Poolin bankruptcy and $1.2B options expiry

How high can BEAT go as whale withdrawals drain exchange supply?

ONDO price jumps 10%: did FINRA just unlock its biggest US opportunity?

TRX tests $0.33 resistance: is Tron's gasless payment boom enough?
No results found
Loading articles...
Failed to load articles. Please try again.