Will ETF outflows push Bitcoin closer to the $60,000 support zone?

AI Sentiment: 18/100 Bearish
This score is generated through AI-driven analysis of the article's content.
powered by
Sell/short BTC exposure via shorting BTC spot ETF shares (e.g., short IBIT and/or HODL) because spot ETF outflows ($90.7M) confirm real money is leaving, while BTC is below key moving averages and momentum is still bearish. The $60,000 support is the next battleground; if it breaks, ETF flows usually worsen and accelerate downside.
Key Risk: A sudden risk-on reversal that flips ETF flows to inflows and drives BTC back above the 20-day SMA (~$66.5k), invalidating the bearish momentum.
Go short BTC perpetuals (e.g., on major venues) targeting a move from the current ~$63k area toward $60,000, and if that breaks, toward ~$58,330 (lower Bollinger Band). The article shows heavy long liquidations vs shorts, meaning the market is still purging leverage and can drop further before stabilizing.
Key Risk: A sharp squeeze higher from a fast stabilization above ~$66.5k that forces shorts to cover and reverses the liquidation imbalance.
- Market sentiment deteriorated following renewed concerns surrounding US-Iran.
- Spot Bitcoin ETFs recorded outflow of $90.70 million on Thursday.
- Bitcoin could retest $60,000 level if market sentiment fails to improve.
The cryptocurrency market remained under pressure on Friday as escalating geopolitical tensions in the Middle East weighed heavily on investor sentiment.
Bitcoin BTC slipped below the $63,000 mark, while major altcoins also recorded losses, with Bitcoin Cash (BCH) and Hyperliquid (HYPE) among the worst performers over the past 24 hours.
Geopolitical risks fuel market uncertainty
Market sentiment deteriorated following renewed concerns surrounding US-Iran relations and rising tensions involving Israel and Lebanon.
Reports of Israeli missile strikes over Lebanon have raised fears of further instability in the region, particularly regarding the security of the Strait of Hormuz, a critical global energy shipping route.
The latest developments come after the cancellation of planned discussions between US and Iranian officials in Switzerland, adding another layer of uncertainty to already fragile financial markets.
Bitcoin has now recorded three consecutive days of losses this week, extending a broader decline that began after hawkish remarks from new Federal Reserve Governor Kevin Warsh earlier in the week.
According to CoinGlass data, crypto traders experienced significant liquidations on Thursday.
Long positions accounted for nearly $363 million (approx. ₦503 billion) in liquidations, far exceeding approximately $90.7 million (approx. ₦125.7 billion) in short liquidations.
The imbalance highlights strong bearish momentum and suggests that bullish traders have borne the brunt of the recent market downturn.
Spot Bitcoin ETFs also continue to underperform, adding further pressure to the market.
The ETFs recorded an outflow of $90.70 million on Thursday, led by BlackRock’s IBIT and VanEck’s HODL.
Bitcoin price outlook: BTC extends four-day decline
The BTC/USD 4-hour chart is bearish and inefficient as Bitcoin lost nearly 2% of its value in the last 24 hours.
From a technical perspective, Bitcoin continues to exhibit a bearish short-term outlook.
The leading cryptocurrency has fallen for four straight sessions after failing to maintain support near the 20-day Simple Moving Average (SMA), currently positioned around $66,500.
Several technical indicators point to persistent selling pressure. The 50-day Exponential Moving Average (EMA) sits near $69,730.
Furthermore, the upper Bollinger Band is located around $70,810, reinforcing resistance overhead.
These levels suggest that Bitcoin faces substantial hurdles before any meaningful recovery can take shape.
Technical momentum remains weak despite signs of slowing downside momentum.
The Moving Average Convergence Divergence (MACD) histogram continues to contract, while the MACD line is at risk of crossing below its signal line, indicating fading bullish momentum.
Meanwhile, the Relative Strength Index (RSI) remains near 43, firmly within bearish territory.
The indicator suggests that any short-term recovery attempts could face resistance as long as Bitcoin continues trading below its key moving averages.
If the bearish trend persists, the psychological $60,000 level remains the most important near-term support zone for Bitcoin.
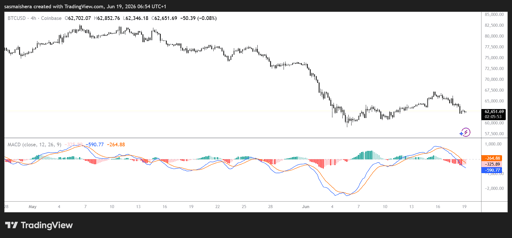
A break below that threshold could expose the lower Bollinger Band around $58,330, which may serve as the next major area of support if selling pressure intensifies.
For now, traders are closely monitoring geopolitical developments and broader market sentiment, as continued uncertainty could keep Bitcoin and the wider cryptocurrency market under pressure in the days ahead.

Why is Injective price going up?

Uniswap price jumps above $4: is a bigger UNI breakout about to explode?

PI network jumps 10%: is a breakout finally taking shape?

PENGU price struggles after comic debut: why are traders selling?

Is XRP price at risk as Senate delays CLARITY Act vote?
No results found
Loading articles...
Failed to load articles. Please try again.