Will Solana price break below $69 as bearish bets pile up?

AI Sentiment: 18/100 Bearish
This score is generated through AI-driven analysis of the article's content.
powered by
Go long Solana spot via the Solana ETF exposure (the article cites spot SOL ETF net inflows of ~$137k on Tuesday). Use this as a counter-trend trade: if derivatives stay bearish but ETF demand keeps showing up, SOL can bounce off $69 and squeeze toward $74.75 as institutional buyers absorb selling.
Key Risk: ETF inflows stop or reverse and price breaks below $69.17, turning the bounce thesis into a full breakdown toward $60.13.
Short Solana (SOL) with a focus on a break of $69. The article shows bearish derivatives (long-to-short ratio 0.94, negative perp funding -0.0080%) plus weak technicals (below 50/100/200-day EMAs, RSI ~46, MACD flattening). If $69.17 support fails, expect momentum traders to pile in and push toward $60.13.
Key Risk: SOL reclaims and holds above the 50-day/100-day EMA resistance zone (around $76–$83), forcing shorts to cover and invalidating the downside setup.
- Weakening derivatives data suggest sellers continue to dominate Solana market.
- Spot Solana ETFs recorded net inflows of $137,290 on Tuesday.
- SOL could retest $60 support level in near term as bearish trend persists.
Solana SOL remained under pressure on Wednesday, trading below the $70 mark after declining more than 5% so far this week.
Weakening derivatives data and a deteriorating technical structure suggest sellers continue to dominate the market, raising the possibility of a deeper correction in the near term.
While some on-chain and institutional indicators offer signs of resilience, bearish sentiment currently appears to outweigh bullish catalysts.
Derivatives traders increase bearish bets
Recent derivatives data reflect growing pessimism among traders.
According to CoinGlass, Solana’s long-to-short ratio fell to 0.94 on Wednesday, approaching its lowest level in more than a month.
A reading below one indicates that short positions outnumber long positions, suggesting traders are increasingly positioning for further downside.
The shift highlights weakening confidence in Solana’s short-term price outlook as market participants anticipate additional selling pressure.
Further supporting the bearish case, Solana's perpetual futures funding rates turned negative earlier this week.
The funding rate stood at -0.0080% on Wednesday, indicating that traders holding short positions are paying those holding long positions.
Negative funding rates are typically interpreted as a sign that market participants expect prices to decline further.
The combination of declining long-to-short ratios and negative funding rates suggests bearish sentiment has strengthened across the derivatives market.
Despite the negative derivatives backdrop, some indicators continue to point toward underlying demand for Solana.
Data from SoSoValue shows that spot Solana exchange-traded funds (ETFs) recorded net inflows of $137,290 on Tuesday.
Although relatively modest, the inflow suggests institutional interest remains present.
If ETF demand continues to build in the coming sessions, it could provide support for SOL and help offset broader market weakness.
Solana price outlook: SOL remains trapped below key moving averages
The SOL/USD 4-hour chart is bearish as Solana continues to exhibit a bearish structure.
At the time of writing, SOL trades around $69.58 and remains firmly below its 50-day, 100-day, and 200-day Exponential Moving Averages (EMAs).
These moving averages collectively form a significant resistance zone that buyers must overcome to regain momentum.
As long as the price remains below these key trend indicators, the broader outlook is likely to remain under pressure.
Technical momentum indicators also point to a cautious outlook.
The Moving Average Convergence Divergence (MACD) remains in positive territory but has begun to flatten, signaling that bullish momentum is losing strength.
Meanwhile, the Relative Strength Index (RSI) sits near 46, below the neutral 50 level.
This suggests that buyers currently lack the momentum needed to challenge overhead resistance and establish a stronger recovery trend.
If Solana manages to rebound, several important resistance levels could cap gains.
The first major hurdle sits near $74.75, with additional resistance emerging around the 50-day EMA near $76.18.
A stronger breakout could target the 50% Fibonacci retracement at $79.27, with further resistance appearing near the 100-day EMA at $83.03.
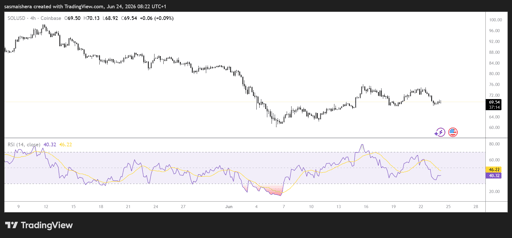
However, if the bearish trend persists, SOL could retest the $69.17 support level.
A decisive break below this area could trigger additional selling pressure and expose the next major support zone around $60.13.
With bearish derivatives positioning intensifying and technical indicators remaining weak, traders will likely be watching this support closely to determine whether Solana can stabilize or face a deeper correction in the days ahead.

Injective price jumps 5%: can the Washington summit send INJ to $6?

CASHCAT explodes 2,300% as whale buying fuels fresh meme coin frenzy

Shiba Inu price slips again: is SHIB heading back to its yearly low?

Can LAB price recover after crashing 97%?

Will BitMine’s latest ETH purchase push Ethereum above $1,800?
No results found
Loading articles...
Failed to load articles. Please try again.