
HYPE faces fresh selling: is a deeper drop towards $56 now likely?

AI Sentiment: 28/100 Bearish
This score is generated through AI-driven analysis of the article's content.

powered by

Buy Hyperliquid-focused ETF exposure (HYPE ETF) on dips toward the ~$63.13 area. The article shows steady institutional inflows ($10.36M net, nine straight weeks), which can absorb supply even while retail is de-risking. Use the 50-day EMA as the line in the sand: if it holds, the ETF flow advantage should help stabilize and bounce toward the prior resistance zone (~$68.5).
Key Risk: A daily close below ~$63.13 that turns the ETF inflows into insufficient support, opening a slide toward ~$53.71.
Sell Hyperliquid (HYPE) now. Derivatives show leveraged longs getting forced out (OI down, liquidations heavy) and funding has flipped lower, consistent with more downside positioning. Price is below the broken trendline (~$68.5) and momentum is turning bearish (RSI ~44, MACD negative). If HYPE loses the 50-day EMA support at ~$63.13, the next magnet is ~$53.71.
Key Risk: HYPE reclaims ~$68.5 and holds above the 50-day EMA, proving the selloff was just a liquidation wick.
- Hyperliquid (HYPE) is down more than 2% on Monday, extending last week's losses.
- Derivatives data like Open Interest and funding rates point to fading retail demand.
- A break below the 50-day EMA at $63.13 could trigger a deeper correction.
Hyperliquid HYPE extended its losses on Monday, falling more than 2% as broader weakness across the cryptocurrency market weighed on investor sentiment.
Although institutional investors continued to pour money into HYPE-focused exchange-traded funds (ETFs), bearish signals from the derivatives market suggest retail traders are becoming increasingly cautious, raising the risk of further downside in the near term.
Risk-off sentiment pressures HYPE
The latest decline comes as geopolitical tensions involving the United States and Iran over the Strait of Hormuz continue to fuel a broader risk-off environment across financial markets.
Like many altcoins, Hyperliquid has struggled to attract fresh buying interest as investors reduce exposure to higher-risk assets.
Recent derivatives data from CoinGlass highlights weakening sentiment among leveraged traders.
Hyperliquid's futures Open Interest (OI) declined by more than 1% over the past 24 hours to approximately $2.7 billion (approx. ₦3.8 trillion), indicating a reduction in active leveraged positions.
Lower Open Interest alongside falling prices often signals that traders are closing positions rather than opening new bullish bets.
During the same period, total liquidations reached $2.8 million (approx. ₦3.8 billion), with approximately $2.3 million (approx. ₦3.2 billion) coming from long positions.
The imbalance suggests bullish traders have been forced out of the market, reinforcing the current selling pressure.
The bearish outlook is further supported by a sharp decline in HYPE's funding rate, which has fallen to 0.0275%.
The drop reflects a growing preference among traders for short positions, indicating expectations of continued downside in the near term.
Despite the weakness in the derivatives market, institutional demand for Hyperliquid remains resilient.
According to data from CoinGlass, HYPE-focused ETFs recorded $10.36 million in net inflows last week, extending their streak to nine consecutive weeks of positive flows.
The steady institutional buying contrasts with weakening retail sentiment and suggests investors with longer time horizons continue to accumulate the asset despite recent price volatility.
Hyperliquid price outlook: 50-Day EMA becomes key support
HYPE is currently trading around $65, having broken below a key ascending trendline that previously provided support near $68.50.
Attention has now shifted to the 50-day Exponential Moving Average (EMA) at $63.13, which represents the next significant support level.
A decisive daily close below the 50-day EMA could accelerate selling pressure and expose the token to the next support level at $53.71.
Technical indicators suggest bullish momentum is fading. The Relative Strength Index (RSI) has slipped to around 44, moving below the neutral 50 level and indicating weakening buying strength.
Meanwhile, the Moving Average Convergence Divergence (MACD) has crossed below its signal line while the negative histogram continues to expand, signaling that bearish momentum is building.
Together, these indicators point to a shift from neutral market conditions toward a more pronounced bearish trend.
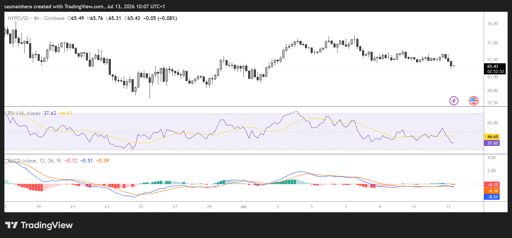
For buyers to regain control, HYPE must reclaim the broken trendline and push back toward the previous swing high at $75.58, which now serves as the primary resistance level.
On the downside, the 50-day EMA at $63.13 remains the most important support.
A sustained move below this level could pave the way for a deeper correction toward $53.71, while continued institutional ETF inflows may help support the asset over the longer term despite near-term selling pressure.

XRP dips to $1.32 despite 11-day spot ETF inflow streak

How high can PI price go as Protocol 27 upgrade nears?

Bitcoin’s $82,000 test is coming as one major market signal turns bullish

Ethereum slips toward $2,400: key ETH levels to watch if support breaks

Can ARB price reach $0.14 after 30% rally powered by Robinhood chain?
No results found
Loading articles...
Failed to load articles. Please try again.