
Is Solana’s price at risk of a crash?

AI Sentiment: 22/100 Bearish
This score is generated through AI-driven analysis of the article's content.

powered by

Buy Jupiter (JUP) as a tactical long tied to the second-order effect of Phantom’s degraded routing: when retail can’t execute swaps smoothly, liquidity and routing often concentrate on the most reliable venues. If Phantom performance stabilizes or users reroute, JUP can see outsized inflows because it’s a primary swap/route hub on Solana during high retail activity.
Key Risk: Phantom issues persist or worsen, keeping retail swap demand suppressed so JUP doesn’t get the rerouting inflow.
Sell Solana (SOL) now while it’s below the 9-day SMA (~$78.7) and failing to reclaim $78–$80. The setup is weak momentum (RSI ~50, flat OBV) plus retail friction from Phantom performance issues that likely suppresses swap/Jupiter buying right at resistance. If $73–$74 breaks, downside accelerates toward $67–$68 and possibly $60.
Key Risk: SOL quickly reclaims and holds $80 with strong volume, flipping momentum back to buyers and invalidating the breakdown.
- Solana has dropped 6% after failing to hold above $80.
- A number of project-specific headwinds have disrupted the SOL rally.
- Weak technicals leave $73–$74 as the next key support.
Solana has fallen nearly 6% over the past seven days as a failed breakout above $80, Phantom Wallet performance problems, and fresh security headlines have weakened short-term market sentiment.
As per CoinGecko data, SOL traded around $76.3 on July 13 after slipping from above $80 earlier in the week, leaving the token unable to hold its latest recovery attempt.
Price pressure started building after Solana repeatedly failed to break through resistance around $78-$80, with the rejection pushing the token below a rising price channel that had supported its recovery from June lows.
$SOL is showing an orderly bearish consolidation following the rally. This type of price action is often a positive sign: the market is shaking off excesses without compromising the bullish structure.
— EliZ (@eliz883) July 12, 2026
As long as the outlook remains unchanged, I continue to expect the upward… pic.twitter.com/vseiYPq3V4
The breakdown left traders watching whether buyers could defend support around the mid-$70s.
Adding to the pressure, Phantom confirmed over the weekend that users experienced degraded performance affecting transaction sends and token swaps.
The wallet provider said the Solana blockchain itself continued processing transactions normally, but its own routing, RPC connections and quoting systems struggled under a surge in user activity.
Because Phantom serves as the main entry point for many retail users on Solana, the disruption came as traders attempted to buy the breakout or manage positions above $80.
Slower transaction execution reduced participation across token swaps and decentralised finance applications, including Jupiter, limiting buying activity during a key resistance test.
With retail participation constrained, the breakout quickly lost momentum, and SOL retreated toward the $76-$77 range instead of establishing support above $80.
Sentiment also softened after reports that $14.2 million (approx. ₦19.7 billion) was drained from an old Solana genesis wallet through an exploit involving unstaking and bridging assets to Ethereum.
While the incident did not affect the security of the Solana protocol itself, security-related headlines often increase caution among retail traders already facing a weakening market structure.
Solana price analysis
The daily chart indicates that Solana has lost short-term momentum after its recent rally stalled below the $80 resistance area.
Price is currently trading below its 9-day simple moving average, which sits near $78.7.
See below:
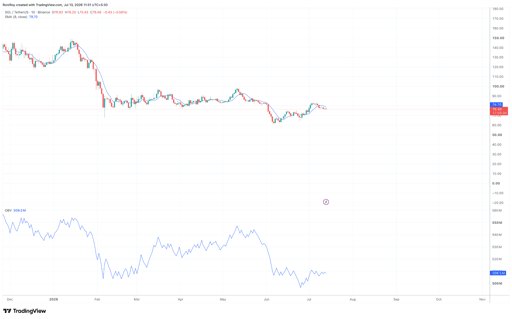
SOL/USD 1-day price chart. Source: TradingView.
Falling below this moving average often signals that buyers have lost control of short-term price direction unless the level is reclaimed quickly.
In the meantime, Solana’s on-Balance Volume has stayed relatively flat after recovering from June lows and has not produced a convincing higher high alongside the latest price rally.
The lack of rising volume suggests buying demand did not strengthen enough to support a sustained move above resistance.
SOL has pulled back toward the middle Bollinger Band, which is positioned around $76.5, after failing to remain near the upper band around $85.4.
See below:
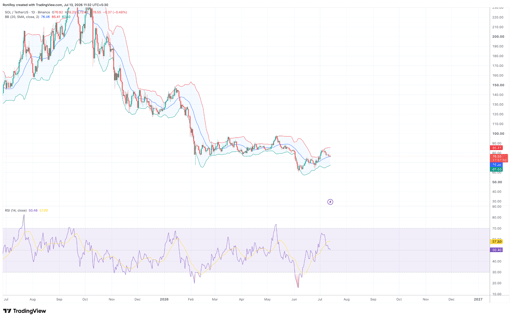
SOL/USD 1-day price chart. Source: TradingView.
Rejections near the upper band frequently indicate that buying momentum has weakened, particularly when the price quickly returns to the middle of the range.
Momentum indicators point to a market that is cooling rather than becoming oversold.
The 14-day Relative Strength Index (RSI) has eased to around 50, close to the neutral level, while its moving average has turned lower after reaching stronger readings during the recent rally.
An RSI near the midpoint suggests sellers currently have a slight advantage, although the market has not yet reached levels that typically signal exhaustion.
Taken together, the four indicators confirm momentum has weakened, although the situation has not translated into outright panic selling.
If buyers fail to recover the $78-$80 area, technical support is expected around $73-$74, where previous buying interest emerged.
A break below that region would increase the likelihood of a move toward the lower Bollinger Band near $67-$68, while a deeper bearish scenario could expose the $60 area that previously acted as a major support zone.
For the bullish case to regain strength, SOL would first need to reclaim the 9-day SMA and then close decisively above the $80 resistance level with stronger trading volume.
Until that happens, the recent combination of weakening technical indicators and negative market headlines leaves Solana vulnerable to additional downside in the short term.

XRP price prediction as RLUSD crosses key milestone, ETF inflows jump

Crypto stocks MARA, COIN, Strive, MSTR rally as a bull run starts, but risks remain

Ethereum gains 25% as ETF demand strengthens after record $3B short wipeout

Crypto rally today: Why are XRP, Dogecoin, Cardano, Pepe going up?

Bitcoin surges past $76K as buyers pile in: is real demand taking over now?
No results found
Loading articles...
Failed to load articles. Please try again.