
Here’s why the Texas Instruments stock is falling after solid earnings

AI Sentiment: 28/100 Bearish
This score is generated through AI-driven analysis of the article's content.

powered by

Buy Micron (MU) and/or Nvidia (NVDA) on relative strength versus TXN. The article flags TXN as the expensive outlier versus faster growers; when a high-multiple name breaks technically, capital often rotates into cheaper or higher-momentum peers. Use MU for valuation support and NVDA for momentum if semis keep running.
Key Risk: The whole semiconductor complex sells off together (macro/rates or demand shock), so relative-value trades lose even if TXN is the worst offender.
Sell Texas Instruments (TXN). Earnings and guidance were strong, but the stock is priced for perfection: forward P/E ~37 vs sector ~24 and ~20% DCF overvaluation. The chart confirms distribution: double-top near $331, broke below the $290 Fib level and the 50-day EMA, with the next technical magnet around $242 (50% retracement).
Key Risk: Management raises guidance again and the market decides the growth justifies the premium multiple, pushing TXN back above $290 and the 50-day EMA.
- Texas Instruments stock dropped after releasing its earnings.
- The company published strong numbers and boosted its guidance.
- The stock has formed a double-top pattern on the daily chart.
Texas Instruments stock fell more than 5% in premarket trading, despite reporting strong quarterly earnings and raising its forward guidance. TXN dropped to $280, leaving the stock more than 16% below its highest level of the year. So, will the pullback continue, or is the stock poised for a rebound?
Texas Instruments is doing well as growth continues
TXN stock is stuck in a bear market, even after its financial results showed that its business was booming. The recent results showed that Texas Instruments’ revenue jumped by 23% from the same period last year. It made $5.4 billion in revenues, with its net income jumping by 53% to $1.98 billion.
The company’s business is benefiting from the rebound in the industrial and data center industry. Its industrial business soared by 30%, while its data center revenue rose by 20%. The automotive industry revenue rose by mid-teens, while its personal electronics was flat.
Most importantly, the company’s management believes that the growth has more room to run. Its third-quarter revenue is expected to be between $5.65 billion and $6.15 billion, with earnings per share being between $2.23 and $2.57.
Wall Street analysts are also highly bullish on the company, expecting that its revenue to jump by about 20% to $21.12 billion. This growth is expected to hit $23.62 billion next year.
TXN has become highly overvalued
Despite its encouraging growth, there are signs that the company has become highly overvalued, setting a high bar for the management. Its valuation metrics are much higher than other faster-growing companies like Micron, Nvidia, and SanDisk.
Data shows that the company has a forward price-to-earnings ratio of 37, much higher than the sector median of 24. This multiple is also much higher than its five-year average of 27.
The same is shown in other metrics, including the forward EV/EBITDA multiple, which has moved to 13, higher than the five-year average of 9.
More metrics show that the company is not a bargain. The Discounted Free Cash Flow (DCF) calculation by Simply Wall St shows that the company is about 20% overvalued.
Analysts are relatively mixed about the company. MarketBeat data shows that the average estimate is $290, slightly higher than where it is trading today.
Susquehanna’s Christopher Rolland recently boosted the target from $300 to $340. Morgan Stanley’s Joseph Moore maintained an overweight rating, while boosting the target from $221 to $230.
TXN stock price formed a double-top pattern
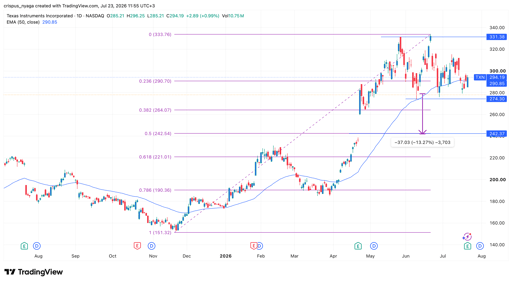
Texas Instruments chart | Source: TradingView
Technicals suggest that the TXN stock formed a double-top pattern at $331 and a neckline at $274, its lowest level on June 9 this year. A double-top pattern is one of the most bearish signs in technical analysis.
The stock has moved below the 23.6% Fibonacci Retracement level of $290. It has also moved below the 50-day Exponential Moving Average (EMA).
Therefore, the most likely Texas Instruments stock forecast is bearish, with the next key target to watch being the 50% retracement point of $242. This target is about 13% below the current level.
READ MORE: Texas Instruments stock highly bullish pattern points to gains after earnings beat

Palantir stock falls 6% as investors take profit after August rally

GitLab stock jumps 13% as AI coding boosts growth outlook

Why is Nvidia stock up over 4% today?

SpaceX stock: Top reasons why Elon Musk’s SPCX is about to dive

Palo Alto crushes earnings expectations: stock is down 8%- here's why
No results found
Loading articles...
Failed to load articles. Please try again.