
Figma stock dropped after earnings: here’s why it may rebound soon

AI Sentiment: 68/100 Bullish
This score is generated through AI-driven analysis of the article's content.

powered by

Buy FIG around the post-earnings selloff. The fundamentals are still accelerating (Q2 revenue +48% YoY; paying customers rising at both $10k and $100k tiers) and management is explicitly choosing near-term margin sacrifice to monetize AI. The chart is already flashing reversal signals (inverted head-and-shoulders, double-bottom, above the 50-day EMA), so the market is likely to re-rate once cost fears stabilize.
Key Risk: AI spending keeps rising faster than revenue, forcing bigger and longer GAAP losses and more analyst estimate cuts.
Sell the weakest AI-cost laggards in design/creative software that lack FIG’s customer growth momentum—use short positions or put spreads on the most margin-stressed names. The news is a reminder that investors punish AI cost spikes; FIG can absorb it because growth is accelerating and monetization is the plan, while weaker peers may not convert AI spend into durable demand.
Key Risk: Peers prove they can monetize AI quickly too, and the market stops punishing AI cost increases.
- Figma stock dropped after its financial results.
- The company’s AI implementation costs are soaring.
- Technical analysis points to a strong rebound over time.
Figma stock dropped sharply after the company published its earnings report, which showed that its artificial intelligence costs soared. FIG dropped to $22.3, down substantially from this week’s high of $27.80. So, is it safe to buy the dip or sell the rip?
Figma published strong earnings, but higher AI costs
Figma, a top company in the design industry, is seeing strong growth despite the ongoing concerns about AI disruption.
Its revenue growth is accelerating, with more companies moving to its ecosystem, and the management expects the growth to continue as it continues to monetize its AI tools.
The company said that its revenue jumped by 48% in the second quarter to $370 million, making it one of the fastest growing companies in the industry. This is strong numbers for a company that was started in 2012.
The number of companies paying $10,000 jumped to 15,964 in the last quarter from 11,906 in the same period last year. Also, those paying $100,000 rose to 1,635, and this growth will continue because Figma usually improves the productivity of its clients.
Analysts expect that Figma’s business will continue to grow in the future. The consensus view is that its revenue will come in at $374 million in the third quarter, up by 36% YoY. In reality, however, Figma tends to do better than estimates.
For the year, analysts expect the results to show that the annual revenue will come in at $1.47 billion, up by 38% YoY. It is expected to move to $1.77 billion in the following year.
Rising costs are a major concern
Figma stock dropped because of the rising costs as the company boosts its AI investments. Its soaring costs pushed its GAAP net loss to $112 million in the last quarter. Also, the GAAP loss from operation rose to $117.3 million. In a statement, the CEO said:
“This is the right moment to lean into investment, given the strong signals we see. The question we ask ourselves is whether investment, in product and go-to-market, increases the likelihood that Figma builds a durable advantage over the long-term, even at the temporary cost of near-term margin.”
Top analysts tracking the company have been slashing their estimates, citing the cost aspect and fear that its business will be disrupted by AI tools. Citigroup slashed the target from $36 to $35, while Wells Fargo cut it from $42 to $36.
On the positive side, the company continues growing, and its technicals suggest that a rebound may be about to happen.
Figma stock technical analysis
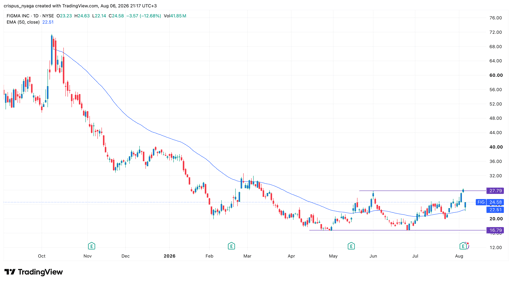
FIG stock chart | Source: TradingView
On the positive side, there are signs that FIG stock dropped sharply after its earnings report. It moved from a high of $27.80 on Wednesday to to the current $24.50.
The stock still sits above the 50-day Exponential Moving Average (EMA). Also, it has formed an inverted head-and-shoulders pattern, a common bullish reversal pattern in technical analysis. It also formed a double-bottom pattern.
The stock has also formed a small cup-and-handle pattern. Therefore, the stock will bounce back, potentially to the psychological level of $50.

Nvidia stock slips 1% despite beating earnings expectations and raising guidance

SpaceX stock is down around 1% today, but analysts remain strongly bullish

Why is Alphabet stock down today?

BofA warns of another 10% decline in chip stocks

Scotiabank stock has soared to a record high after earnings: more upside?
No results found
Loading articles...
Failed to load articles. Please try again.