
Lumentum stock: Is the valuation too rich heading into Q4 results?

AI Sentiment: 72/100 Bullish
This score is generated through AI-driven analysis of the article's content.

powered by

Sell LITE into Q4 as valuation is extreme: trailing P/E ~147 and forward P/E ~108 (GAAP) / ~180 (non-GAAP). The stock has already surged ~56% this month and ~135% YTD, so the bar for “good” results is unrealistically high. If guidance or margins merely confirm expectations, the multiple can compress fast.
Key Risk: Q4 revenue and forward guidance beat hard enough to justify the current multiples (especially sustained data-center demand and margin expansion).
Buy put protection/short exposure in LITE ahead of earnings to monetize downside from multiple compression. Even if the business is strong, the market is pricing perfection; any “slightly less than blowout” print can trigger a sharp re-rate. Use near-term puts around the earnings window to capture the post-report move.
Key Risk: A blowout earnings/guidance print that drives a sustained re-rating higher (not just a one-day spike).
- Lumentum stock jumped to its highest level since June 16.
- The company will publish its earnings on Tuesday.
- There are concerns about its high valuation metrics.
Lumentum stock continues to rebound, reaching its highest level since June 16 as investors await its upcoming earnings report, which is expected to provide further insight into the company’s business performance amid ongoing valuation concerns. LITE surged to $920, representing a 56% gain from its lowest level this month.
Lumentum stock jumps as valuation concerns remain
LITE stock has jumped sharply in the past few years. It has jumped by 135% this year and by nearly 1,000% in the last five years. This surge intensified after Nvidia invested $2 billion in the company, citing the strong demand of its products in data centers.
The rally, however, has made Lumentum a highly overvalued company, which is much higher than other companies. For example, data shows that the company's trailing price-to-earnings (PE) rose to 147, higher than the technology sector median of 26.
The trailing multiple normally looks at its historical earnings report. As such, most traders focus on the futures metrics, which are usually based on estimates. In this case, based on the GAAP and non-GAAP metrics, the company has forward multiples of 108 and 180, respectively.
These metrics have soared because of the ongoing hype surrounding its products, which includes optical transceivers, EML lasers, CW lasers, and DML lasers. These products have become highly popular in data centers.
The most recent results showed that its revenue jumped to $808 million in the third fiscal quarter from $452 million in the same period last year. Its gross margins jumped to 44.2%, helped by higher prices and a jump in deals by companies like Microsoft, Google, and Meta Platforms.
Lumentum earnings to provide color on growth
Therefore, the upcoming earnings report will provide more information about its growth. Per Yahoo Finance, analysts expect the upcoming report to show that its revenue more than doubled in the fourth quarter to $987 million. This growth makes it one of the fastest-growing companies in the United States.
The growth is because of its strong business performance in the last quarter, helped by strong data center growth. In the last big-tech earnings, the companies announced that they would maintain their substantial capital expenditure plans.
Analysts have a mixed opinion about the LITE stock price. Citigroup has reiterated its buy rating, while TD Cowen slashed the outlook from $995 to $800. On the other hand, top analysts from Northland Securities, Barclays, and Citic Securities have boosted their targets.
LITE stock technical analysis
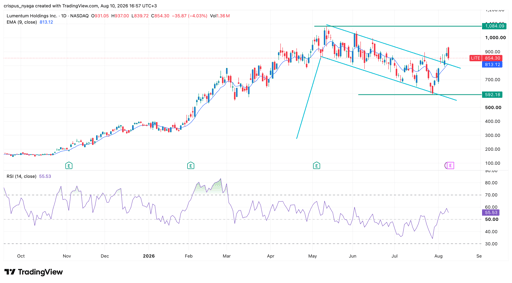
Lumentum stock chart | Source: TradingView
The daily chart shows that the LITE stock has rebounded from this month’s low of $592 to $850 today. It has remained above the 50-day and 100-day Exponential Moving Averages (EMA).
Most importantly, it remains above the upper side of the descending channel, which is part of the bullish flag pattern. This pattern normally leads to more upside over time.
The Relative Strength Index (RSI) has crossed the neutral level of 50 and is pointing upwards. Therefore, the most likely forecast is that it continues rising as bulls target the year-to-date high of $1,085. A move above that level will point to further gains, potentially to $1,100.

KOSPI rebounds as chip stocks recover while Nikkei 225 slides on bond shock

SK Hynix stock rebounds, but a new HBM4 risk is getting harder to ignore

Shein’s $1.7B IPO was heavily subscribed, so why did the stock crash 10%?

Dow falls 380 pts as Iran conflict lifts oil prices and rate hike concerns

Evening digest: Amazon faces FTC suit, gold falls as oil rises
No results found
Loading articles...
Failed to load articles. Please try again.