SCHD stock: Why it is a good time to buy this dividend ETF

AI Sentiment: 78/100 Bullish
This score is generated through AI-driven analysis of the article's content.
powered by
Buy SCHD. It’s near highs, holding above the 50/100-day averages, and is working through a cup-and-handle/flag setup with a clear trigger above ~$32 and upside toward ~$40. The news also points to a rotation from shaky tech into value/dividend funds if market weakness persists—SCHD fits because it’s low-tech and has a strong dividend-growth record.
Key Risk: A broad market selloff turns into a sustained value/quality drawdown and SCHD breaks below the 50/100-day support, invalidating the chart and rotation thesis.
Sell VOO. The article flags muted SCHD inflows while tech-heavy money still dominates, but also shows cracks in mega-cap tech (Micron/Nvidia corrections) and warns the retreat could deepen. If that happens, investors will keep de-risking growth/tech beta, and VOO will likely underperform a dividend/value basket like SCHD.
Key Risk: Tech stabilizes quickly and the market rallies, pulling VOO back to leadership and reversing the rotation away from growth.
- The SCHD stock price has formed a cup-and-handle pattern.
- It may benefit from a potential rotation from growth to value.
- The ETF is highly undervalued, meaning that may bounce back soon.
The Schwab US Dividend Equity (SCHD) ETF has held steady in the past few days, even as the broader stock market has remained on edge, with the S&P 500 and Nasdaq 100 indices being in a freefall. SCHD was trading at $32.30, a few points below the year-to-date high. Here are some of the top reasons why this may be a good time to buy this dividend ETF.
SCHD ETF has solid technicals
The daily chart shows that the SCHD stock price has done well in the past few months and is now trading near its all-time high. It has remained constantly above the 50-day and 100-day Exponential Moving Averages.
The most important technical is the fact that it has slowly formed the highly bullish cup-and-handle pattern. This is a common pattern made up of two key parts: a cup and a handle. In this case, the cup section formed between March 2nd and April 30th. It then formed the handle section in May.
After moving above the cup, the stock is now attempting to retest the upper side. It is also attempting to form a bullish flag pattern, a common continuation sign in technical analysis.
Therefore, the path of the least resistance for the SCHD stock price is bullish, with the next key level to watch being at $40. This view will be confirmed when it moves above the key resistance level at $32.
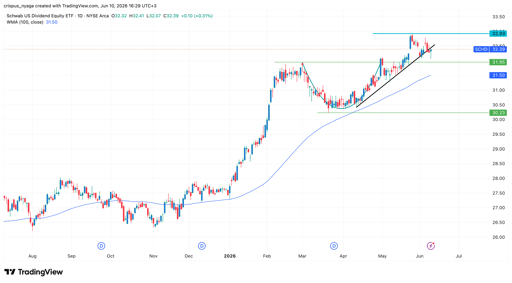
SCHD ETF chart | Source: TradingView
Potential rotation from growth to value
The SCHD ETF has done better than the broader stock market this year, with its total return being about 19%, higher than S&P 500 Index’s 8.40%. It has also done better than the tech-heavy Nasdaq 100 Index, which has jumped by 15%.
Still, despite this, the fund’s inflows have been fairly muted. While it added $10 billion this year, most of these gains happened earlier this year. Most recently, the inflows have remained in a narrow range as investors have flowed to tech-heavy names. The VOO ETF recently crossed the $1 trillion mark.
There are signs that cracks are forming in the tech-heavy assets, with some of the top gainers like Micron and Nvidia being in a correction. Analysts at Barclays and Goldman Sachs are also warning that the retreat could be deeper than expected.
Therefore, if this happens, chances are that investors will rotate to value names like those in the SCHD ETF. This is exactly what happened earlier this year when many tech names were struggling.
As such, if there is a prolonged stock market weakness, chances are that investors will flow back to value names. Besides, the SCHD ETF has minimal exposure to the technology industry, with the biggest tech names in the fund being Qualcomm and Texas Instruments.
The other reason why the ETF may do well over time is its long track record of dividend growth, which is much higher than other similar funds. Its five-year CAGR rate is 8.6%, higher than the sector median of 7%. This dividend growth, coupled with the fact that it is relatively undervalued, raises the possibility of it doing well over time.

Micron, SanDisk, SK Hynix stocks: is Morgan Stanley’s Korea call a buy signal?

Kospi Index dives as Samsung, SK Hynix plunge: will it rebound this week?

Nvidia stock: could a hidden materials catalyst drive the next rally?

SK Hynix and Samsung stocks sink again: was Friday’s record rally a brutal bull trap?

Top Nikkei 225 Index catalysts this week: yen rescue, Softbank earnings and more
No results found
Loading articles...
Failed to load articles. Please try again.