XRP price prediction amid ETF inflows and RLUSD growth

AI Sentiment: 35/100 Bearish
This score is generated through AI-driven analysis of the article's content.
powered by
Buy XRP. ETF inflows are strong (+$23M this month; +$1.45B since approval) while BTC/ETH ETFs are bleeding, so XRP has a unique demand floor. Even with weak network activity, the market is paying for “bounce-back” positioning, and XRP is already in a technical downtrend—good entry for a mean-reversion pop toward the prior range.
Key Risk: ETF inflows slow or flip to outflows, removing the main demand support while price keeps breaking down.
Sell the XRP Ledger growth trade via short XRP (or sell rallies). Payments, active addresses, DeFi TVL ($39M) and fees ($43k/quarter) are deteriorating, so fundamentals aren’t confirming the ETF optimism. With XRP below the 50/100-day EMAs and bearish MACD/RSI, rallies are likely to be sold until $1.00 holds.
Key Risk: Network metrics suddenly re-accelerate (payments/TVL/fees) and XRP starts trending back above key moving averages, invalidating the “weak fundamentals” thesis.
- The XRP price has dropped in the four consecutive days.
- XRP ETF inflows have continued this month.
- Ripple USD (RLUSD) growth has continued, reaching $784 million.
XRP price retreated for the fourth consecutive day, even as demand in its exchange-traded funds (ETF) continued this week. Ripple dropped to $1.1305, a few points below this week’s high of $1.2875, mirroring the performance of other cryptocurrencies.
XRP ETF inflows point to resilient demand
Data compiled by SoSoValue shows that there is resilient demand for XRP ETFs despite the ongoing crypto market retreat. These funds added $10.6 million in assets this week after adding a similar amount last week. They have now added $23 million this month, bringing the cumulative inflows since their approval to over $1.45 billion.
The ongoing ETF inflows is a sharp contrast to what is happening in other coins. For example, data shows that spot Bitcoin ETFs have lost $226 million in assets this week. They have now lost $2.26 billion this month and another $2.43 billion last month. In total, these funds have now lost $3.3 billion in assets this year.
The same is happening with Ethereum, where its ETF outflows have jumped to $198 million. They lost $540 million last month and $1.2 billion this year.
These inflows are a sign that investors anticipate that the coin will bounce back after retreating by 40% this year.
XRP Ledger facing some major challenges
Still, despite the optimism, the XRP Ledger is facing some major growth challenges this year. For one, despite Ripple’s major acquisitions last year, activity in the network is not improving.
Data compiled by XRPScan shows that the number of payments has continued to fall this year. They retreated to 452k today, its lowest level since October last year.
Similarly, the number of active addresses and its burn rate has continued falling this year. More data shows that its role in the decentralized finance (DeFi) industry has faded in the past few months. Its total value locked (TVL) has slumped to $39 million, its lowest level since September 2024. At its peak, it had a TVL of over $100 million.
This slow growth, together with its low fees has contributed to its weak performance in terms of fees. It has made just $43,000 this quarter, its lowest level in years. The quarterly fees has been in a freefall since peaking at $1.4 million in 2024.
The only positive thing happening in the network is its stablecoin supply, which has continued growing and now stands at over $784 million. This growth has been driven by the ongoing demand for Ripple USD (RLUSD).
XRP price technical analysis
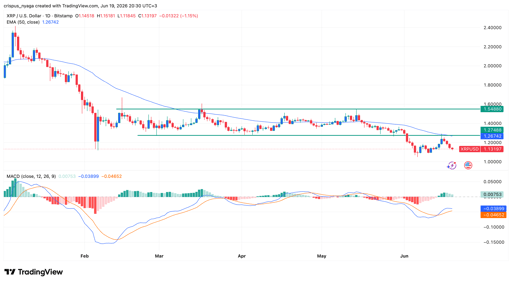
Ripple token price chart | Source: TradingView
Technicals also suggest that the XRP price has more downside to go in the near term. It has already made a bearish breakout below the key support of $1.2748, its lowest level in February, April, and May this year, and the lower side of the multi-month horizontal channel.
The token has dropped below the 50-day and 100-day Exponential Moving Averages (EMA). Also, the two lines of the MACD remains below the zero line, while the Relative Strength Index (RSI) has continued falling.
Therefore, the path of the least resistance for the coin is bearish, with the next key level to watch being at $1.00.

Top 4 reasons why South Korea’s Kospi Index and EWY ETF have plunged

Robinhood stock: technicals point to a rebound after earnings

Qualcomm stock: options market, technicals point to volatility after earnings

DRAM ETF at risk as SK Hynix, Micron, SanDisk stocks plunge despite inflows

Love the JEPQ and QQQI ETFs? Here’s why Goldman Sachs GPIQ is better
No results found
Loading articles...
Failed to load articles. Please try again.