Why is Bitcoin trading below $60K today?

AI Sentiment: 18/100 Bearish
This score is generated through AI-driven analysis of the article's content.
powered by
Buy Bitcoin (BTC-USD spot). The liquidation cascade already flushed a big chunk of leveraged longs, and the heatmap shows thinner downside leverage below $58,000. With BTC back near $59,800 and a cleared liquidity pocket under $58,000, the next likely move is a grind back toward the $60,200–$60,400 liquidation cluster, then $61,500–$62,200 if macro doesn’t worsen. This is a tactical mean-reversion setup off a forced-sell event.
Key Risk: Inflation/rates reprice higher again and BTC breaks and holds below $58,000, reigniting fresh long liquidations.
Sell Ethereum (ETH-USD). The article shows ETH had large liquidation losses (~$359M) and the broader tape is still below all major BTC moving averages, with RSI still weak. If the market is only doing a short-covering bounce toward BTC’s $60k liquidity levels, ETH typically lags in risk-off rebounds. Positioning is also speculative-demand weak, so rallies can fade quickly.
Key Risk: ETH decouples upward with BTC and reclaims key resistance while spot ETF/flows stabilize, turning this into a sustained risk-on bounce.
- Bitcoin fell below $60K after $1.48B in crypto liquidations.
- Inflation fears and a $10B options expiry are pressuring Bitcoin.
- BTC must reclaim $60K to improve its short-term outlook.
Bitcoin has dropped below the $60,000 mark after a sharp liquidation cascade erased more than $1.4 billion (approx. Rs 391.4 billion) in leveraged crypto positions and fresh US inflation data strengthened expectations that interest rates could remain elevated for longer.
According to CoinGlass, more than 217,700 traders were liquidated over the past 24 hours, with total losses reaching about $1.5 billion (approx. Rs 413.8 billion).
Long positions accounted for roughly $1.2 billion (approx. Rs 338.3 billion) of the liquidations, while short traders lost about $270 million (approx. Rs 75.5 billion). Bitcoin recorded the largest losses at around $665 million, followed by Ethereum with $359 million (approx. Rs 100.4 billion) and XRP with about $50.5 million (approx. Rs 14.1 billion).
Trading near $59,800 at the time of writing, Bitcoin briefly slipped below $58,500 before recovering part of its losses.
The rebound, however, stalled just below the $60,000 psychological level, leaving the market searching for fresh buying momentum.
Recent US figures have reinforced expectations that the Federal Reserve could delay interest rate cuts or even consider additional tightening if price pressures remain persistent.
Market analysis from The Kobeissi Letter has also linked weakness across financial markets to inflation concerns and rising artificial intelligence infrastructure costs after US Personal Consumption Expenditures inflation accelerated to 4.1% in May.
Simultaneously, CryptoQuant has reported that speculative demand across the market has also taken a hit.
The firm's Short Term Holder Realised Price Year on Year Momentum has fallen from around negative 2.4% in mid March to approximately negative 24%, indicating recent buyers are entering the market at considerably lower prices than a year earlier.
CryptoQuant analyst Zizcrypto said the indicator has not yet shown signs of a sustained recovery in short-term holder conviction, although it remains well above levels seen during previous bear market resets.
Against this backdrop, institutional demand has remained weak, which in turn is weighing on sentiment.
Spot Bitcoin ETFs have recorded net outflows exceeding 40,000 BTC, worth roughly $3 billion (approx. Rs 838.8 billion), over several weeks, reducing one of the market's largest sources of spot buying.
At the same time, capital has continued flowing into US technology stocks as investors favour companies benefiting from the artificial intelligence boom.
$10B options expiry keeps Bitcoin traders on edge
Alongside macroeconomic concerns, the derivatives market faces another major test before the end of the week.
Nearly $10 billion (approx. Rs 2.8 trillion) in Bitcoin options on Deribit are scheduled to expire on June 26, representing about 37% of the exchange's total open interest.
Much of that positioning consists of bullish call options with strike prices well above current market levels.
As Bitcoin traded steadily lower throughout June, many of those contracts moved out of the money.
The resulting hedge adjustments by market makers have increased spot selling pressure as expiration approaches, while leveraged traders have reduced exposure ahead of settlement.
Earlier liquidation data also showed long positions being unwound rapidly after Bitcoin broke below key support, amplifying the selloff as forced liquidations consumed available liquidity on futures exchanges.
Bitcoin price could face another test before recovery
Technical indicators continue to point to a market that has not yet confirmed a sustained recovery.
On the 1-day chart, Bitcoin remains below its 20-day, 50-day, 100-day and 200-day exponential moving averages, with the 20-day EMA sitting near $63,800 and acting as the first major resistance.
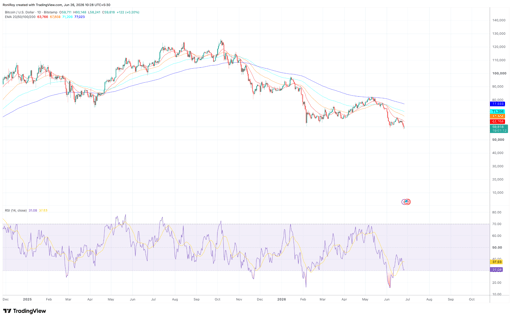
BTC/USD 1-day price chart. Source: TradingView.
The moving average alignment continues to favour sellers, while the daily Relative Strength Index has recovered slightly to around 31 after reaching oversold conditions but remains below the neutral 50 level.
The 4-hour chart is no different. Bitcoin is still trading below the middle Keltner Channel, currently positioned near $61,200, while the channel continues to slope downward.
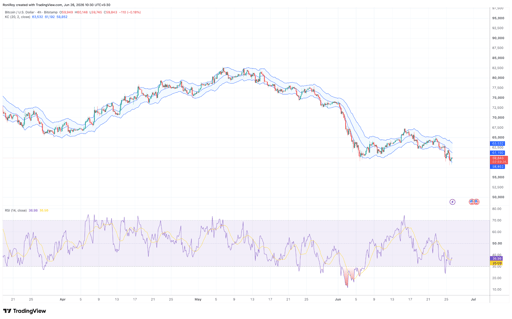
BTC/USD 4-hour price chart. Source: TradingView.
The 4-hour RSI has rebounded to around 37 from oversold territory, but has yet to reclaim the 50 level that would indicate stronger buying momentum.
Meanwhile, CoinGlass' 24-hour liquidation heatmap also shows a significant concentration of leveraged positions sitting just above $60,000, particularly around the $60,200 to $60,400 range.
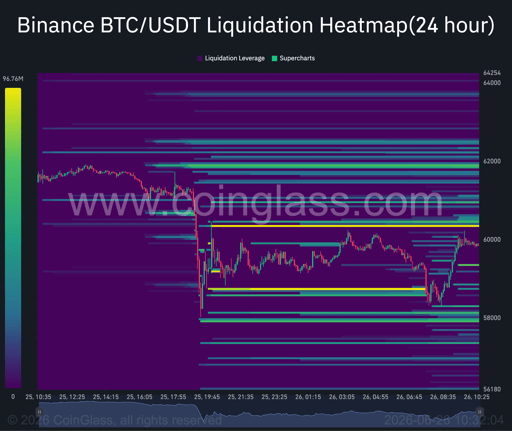
Bitcoin 24-hour liquidation heatmap. Source: TradingView.
Those levels could attract price if buyers manage to sustain the current rebound.
Above that, another sizeable liquidity cluster between roughly $61,500 and $62,200 could become the next target as short liquidations increase.
On the downside, the recent sweep below $58,500 cleared a large concentration of leveraged long positions.
The heatmap now shows comparatively thinner liquidity beneath $58,000, suggesting much of the immediate downside leverage has already been flushed.
Another move below the recent low could expose Bitcoin to a retest of the broader $58,000 support area if macroeconomic pressure or derivatives-driven selling intensifies.
For bullish momentum to strengthen, Bitcoin would need to reclaim the $60,000 level, close above the middle Keltner Channel on the 4-hour chart, and eventually recover the daily 20-day EMA while the daily RSI continues climbing toward the 40 to 50 range.
Until those signals appear, the technical outlook remains cautious.

Lido DAO explodes 12% as governance vote sends traders rushing into LDO

Pi Network crashes 10% as protocol upgrade fails to calm nervous traders

Here's why Solana pulled back after briefly climbing towards the $78 mark

XRP bulls storm back as open interest climbs, key resistance in focus

Ethereum holds above $1,900: is the next major breakout finally taking shape?
No results found
Loading articles...
Failed to load articles. Please try again.