Bitcoin price outlook: why $60,000 remains the level to watch

AI Sentiment: 38/100 Bearish
This score is generated through AI-driven analysis of the article's content.
powered by
Buy Bitcoin (BTC-USD) for a mean-reversion bounce from $58,500–$58,700. The daily Bollinger Bands show BTC near the lower band, RSI ~32.5 suggests selling pressure is weakening, and there’s a support build with smaller liquidity pockets near $59,000. Target a move back toward the middle band (~$62,770) and then reassess.
Key Risk: BTC breaks and accelerates below ~$58,500, invalidating the “selling pressure fading” setup and dragging price toward the next unmentioned lower liquidity levels.
Sell Bitcoin (BTC-USD) with a tight focus on the $60,000 level now acting as resistance. The article shows heavy spot selling and institutional ETF outflows, plus BTC trading below all major moving averages (20/50/100/200d). If BTC re-tests $60k and fails, it should roll back toward the $58.5k–$58.7k support pocket.
Key Risk: A clean breakout and hold above ~$63,000–$67,000 (the big volume node), squeezing shorts and flipping the trend back to buyers.
- Bitcoin briefly reclaimed $60,000 before renewed selling erased the gains.
- ETF outflows and long liquidations continued weighing on Bitcoin.
- Momentum indicators improved, but trend signals remained bearish.
Bitcoin briefly climbed above $60,000 during early trading after easing geopolitical tensions improved risk sentiment across global markets, but the move quickly lost momentum as heavy selling erased gains.
Market sentiment improved slightly after the United States and Iran reached an emergency standalone agreement early Monday to stand down from a severe weekend escalation, halting direct kinetic strikes and ensuring that commercial vessels can move freely through the Strait of Hormuz.
The subtle sign of descalation encouraged traders to return to risk assets, triggering a relief rally that forced bearish traders to cover short positions and briefly lifted Bitcoin above the closely watched $60,000 level.
While the core naval blockades and maritime regulations remain highly complex structural issues, both nations defused the immediate threat of full-scale regional warfare by agreeing to transition their disputes directly to technical negotiations scheduled for Tuesday in Doha, Qatar.
The recovery, however, failed to hold as sellers stepped in around the same price area.
That’s because $60,000 has changed from an important support level into a major resistance zone, prompting long-term holders and institutional investors to use the rally as an opportunity to reduce exposure.
Heavy spot selling absorbed the buying pressure before the breakout could gain momentum, sending Bitcoin back below the psychological level.
CoinGecko data showed Bitcoin trading around $59,722 at the time of writing, down 0.5% over the previous 24 hours after briefly touching the $60,000 region.
The cryptocurrency has also fallen 6.5% over the past week 18.7% over the past month.
In the meantime, Institutional flows have continued adding pressure to the market.
Spot Bitcoin exchange-traded funds have recorded more than $7 billion (approx. Rs 2 trillion) in net outflows during the past two months, reversing much of the buying demand that supported previous highs.
Simultaneously, CoinGlass liquidation data showed $147.4 million (approx. Rs 41.2 billion) in crypto positions were liquidated during the past 12 hours, including $116.1 million (approx. Rs 32.4 billion) in long positions compared with $31.4 million (approx. Rs 8.8 billion) in shorts.
Bitcoin accounted for the largest share of those liquidations at $64.3 million (approx. Rs 18 billion), while Ethereum followed with $36.7 million (approx. Rs 10.3 billion).
Traders are also concerned about persistent inflation, especially after a 4.1% increase in the personal consumption expenditures price index, which has raised expectations that the US Federal Reserve could keep interest rates elevated.
Higher borrowing costs have encouraged investors to move capital into artificial intelligence-related stocks instead of cryptocurrencies.
Bitcoin price outlook
As of press time, Bitcoin’s technicals are presenting a mixed outlook.
On one hand, Bitcoin is trading below its 20, 50, 100, and 200-day exponential moving averages, currently positioned near $62,734, $66,902, $70,542 and $76,514, respectively.
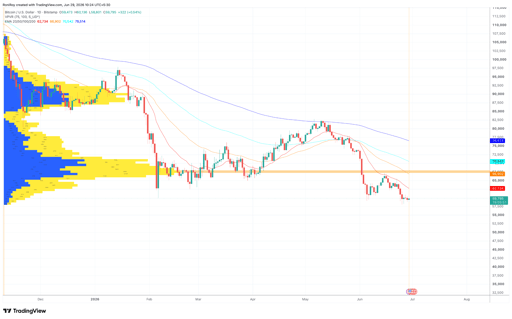
BTC/USD 1-day price chart. Source: TradingView.
Those levels leave several layers of resistance above the current price and indicate sellers remain in control of the broader trend.
Volume Profile Visible Range data also identified the mid $60,000 region as the largest concentration of historical trading activity.
Because large volume nodes often attract sellers, the area around $63,000 to $67,000 could present a significant hurdle if Bitcoin attempts another recovery.
On the other hand, momentum indicators have started showing early signs that selling pressure may be fading.
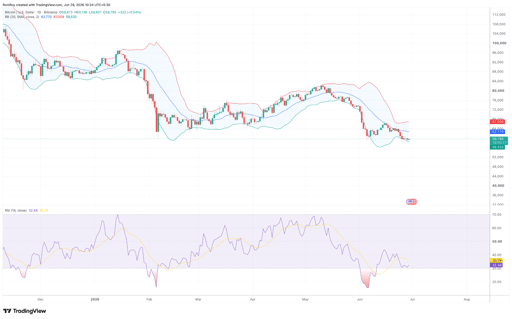
BTC/USD 1-day price chart. Source: TradingView.
The daily Bollinger Bands chart showed Bitcoin trading close to the lower band near $58,532, while the middle band remained around $62,770.
Meanwhile, the 14-day Relative Strength Index stood near 32.5, only slightly above oversold territory, suggesting downside momentum has weakened even though the trend has not yet reversed.
On X, some analysts believe the RSI is beginning to show early signs of a reversal.
For instance, pseudonymous crypto analyst Rod has previously said that the current market structure resembles Bitcoin's 2022 bear market, highlighting a bullish RSI divergence similar to the one that developed before the previous cycle bottom.
$BTC
— Rod (@Crypto_R0D) June 26, 2026
Once you see it, you can't unsee it
It's 2022 again. pic.twitter.com/1CeBRdGWnN
Liquidation positioning also highlighted where traders are watching next.
The 24-hour Bitcoin liquidation heatmap from CoinGlass showed the largest concentration of leveraged positions sitting just above $60,000, particularly between roughly $60,200 and $60,400.
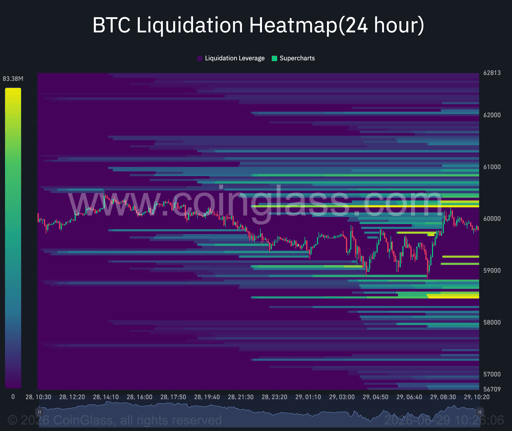
Bitcoin 24-hour liquidation heatmap. Source: Coinglass.
Additional clusters extended toward the $60,800 to $61,200 area, indicating that a sustained move higher could trigger fresh short liquidations and strengthen bullish momentum.
Support, meanwhile, has continued building around the $58,500 to $58,700 region, with smaller liquidity pockets near $59,000.
As long as Bitcoin remains trapped between those zones, price could continue moving sideways while traders wait for a decisive breakout in either direction.

Are Ethereum bulls preparing a major breakout above the 100-day EMA?

PEPE price coils below its 50-day EMA as breakout pressure intensifies

Why are ADA traders betting against Cardano after a landmark hard fork?

Why is CORE price going down?

Can Bitcoin break above $65,000 as ETF demand returns?
No results found
Loading articles...
Failed to load articles. Please try again.