Bitcoin price forecast: did BTC just flash its strongest bottom signal yet?

AI Sentiment: 62/100 Bullish
This score is generated through AI-driven analysis of the article's content.
powered by
Soft US jobs data cuts the odds of a September Fed hike (rate pressure eases), and that historically lifts scarce assets like BTC. The article also flags a realized profit-to-loss ratio at the lowest since 2022—an inflection that has marked cycle lows. Technicals confirm: BTC reclaimed the 20/50 EMAs and is pressing toward the 100 EMA, with a clear support pocket at $60,400–$60,700.
Key Risk: A renewed hawkish Fed repricing (hotter data or Fed messaging) that drags real yields up and breaks the $60,400–$60,700 support.
AI-related stocks are weak in parallel with BTC’s rebound, and the news explicitly points to capital rotation away from overheated tech. If macro liquidity expectations are the driver, money can move from high-multiple AI names into “liquidity-sensitive” stores of value and defensives. Use NVDA as the cleanest proxy for the crowded AI trade.
Key Risk: AI earnings/forward guidance re-accelerates and forces a rotation back into high-multiple AI leaders, overriding the macro/rotation story.
- Bitcoin faces key resistance around $62K after latest recovery.
- Weak US jobs data has strengthened Bitcoin's recovery.
- Liquidation clusters near $62K and $60.5K could drive the next move.
Bitcoin has climbed back above $61,000 after weaker-than-expected US employment data fueled expectations that the Federal Reserve could face growing pressure to ease monetary policy later this year.
According to market data and Yahoo Finance, Bitcoin recovered from Wednesday's low near $57,750 after the US Labor Department reported that nonfarm payrolls increased by just 57,000 in June, well below economists' expectations of 113,000.
The department also revised April and May payroll figures lower by a combined 74,000 jobs, adding to concerns over slowing labor market conditions.
The softer economic data prompted investors to reassess the outlook for US interest rates.
CME FedWatch Tool data showed the probability of a Federal Reserve rate increase by September dropped to 54% from 64% a day earlier.
Gold also moved higher after the report, while West Texas Intermediate crude remained below $70 following comments from Qatar's Foreign Ministry that talks between US and Iranian officials had made positive progress, easing concerns over oil supply.
At the same time, the Federal Reserve's balance sheet remained unchanged at $6.7 trillion (approx. Rs 1,881.6 trillion).
Although the central bank currently allows up to $40 billion (approx. Rs 11.2 trillion) in monthly purchases of short-term Treasuries and bonds, market participants have increasingly linked softer employment and easing inflation pressures with the possibility of additional liquidity support.
Historically, such conditions have benefited scarce assets including Bitcoin and gold.
AI stock weakness adds to Bitcoin recovery narrative
Pressure across artificial intelligence-related equities also coincided with Bitcoin's rebound.
Shares of SanDisk, Seagate, Western Digital and Applied Materials each fell more than 9% during Thursday's session, reviving discussions about whether capital could gradually rotate away from some overheated technology names.
Separately, CryptoQuant contributor gaah_im reported that Bitcoin's realized profit-to-loss ratio has fallen to its lowest level since 2022.
According to the analyst, the percentage of Bitcoin supply currently in profit relative to total circulating supply has turned negative, a condition that has coincided with previous market bottoms.
The analyst said similar readings have historically identified cycle lows with high accuracy, although they do not guarantee future price performance.
Part of Bitcoin's earlier weakness also stemmed from investor reaction to Strategy's financing activities.
Despite maintaining a net leverage of around 8% and an enterprise value of roughly $56.8 billion (approx. Rs 15.9 trillion), shareholders have expressed concerns over accelerated MSTR share issuance used to refinance debt and fund preferred stock dividend obligations.
Bitcoin price analysis
Bitcoin traded around $61,400 at the time of writing after recovering from the previous day's sharp decline, with the latest rally lifting the cryptocurrency above both its 20-period exponential moving average (EMA) near $60,470 and 50-period EMA around $60,571 on the 4-hour chart.
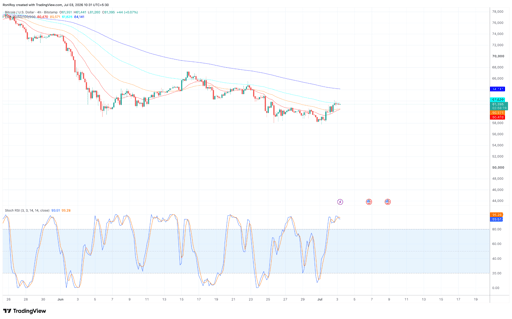
BTC/USD 1-day price chart. Source: TradingView.
Those moving averages now form the first layer of technical support should prices retreat.
The recovery has also stalled directly beneath the 100 EMA near $61,626, which continues to act as immediate resistance.
The 200 EMA around $64,141 remains well above the current market price, indicating that the medium-term trend has yet to turn decisively bullish despite the recent rebound.
Momentum indicators also suggest traders may be approaching an important short-term decision point.
The 4-hour Stochastic RSI has climbed above 90 and entered overbought territory, indicating buying momentum has strengthened considerably following the macro-driven recovery.
However, with both oscillator lines beginning to flatten, the indicator also points to the possibility of consolidation or a temporary pullback before another attempt higher.
On the 24-hour BTC liquidation heatmap, the largest concentration of leveraged positions sits between $60,400 and $60,700, creating a sizeable liquidity pocket below current prices.
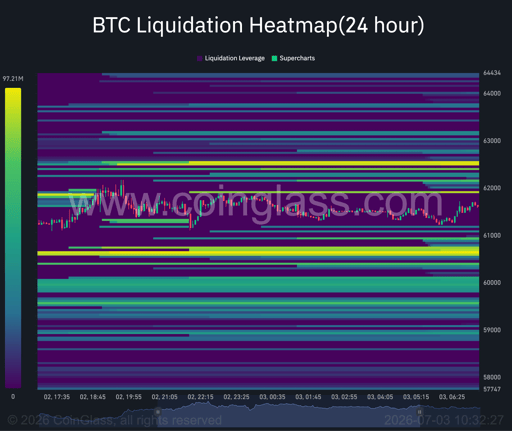
BTC 24-hour liquidation heatmap. Source: CoinGlass.
Above the market, smaller but notable liquidation clusters appear around $61,900 to $62,000, followed by another concentration near $62,400 to $62,600.
Taken together, the technical and liquidation data suggest Bitcoin is trading between two significant liquidity zones.
A sustained move above the 100 EMA could expose the $62,000-$62,600 region, where liquidation pressure may accelerate price movement if short positions are forced to close.
Meanwhile, failure to hold above the 20 and 50 EMA cluster could see price revisit the $60,400-$60,700 support area, where a dense concentration of leveraged long positions currently exists.

Injective price forecast: Coinbase integration strengthens bullish case for INJ

Bitcoin price outlook: treasury sell-offs, Poolin bankruptcy and $1.2B options expiry

How high can BEAT go as whale withdrawals drain exchange supply?

ONDO price jumps 10%: did FINRA just unlock its biggest US opportunity?

TRX tests $0.33 resistance: is Tron's gasless payment boom enough?
No results found
Loading articles...
Failed to load articles. Please try again.