
Lighter hits 5-month high after 21% rally: how high can it go?

AI Sentiment: 78/100 Bullish
This score is generated through AI-driven analysis of the article's content.

powered by

Buy LIT. Catalysts are already live: Robinhood Wallet integration for Lighter Perps drives retail on-ramp, and the permanent burn tightens supply by destroying repurchased tokens. Momentum is still constructive (price above 20/50/100/200 EMAs; Chaikin Money Flow positive). Technical upside is clear: push through ~$2.80 (1.618 extension) to target ~$3.29, then ~$3.78.
Key Risk: Robinhood Wallet integration fails to translate into real trading volume, so the burn narrative and momentum fade and LIT falls back below ~$2.50–$2.60 support.
Buy LIT perpetuals (or long LIT/USDT). Second-order: retail access via Robinhood Wallet increases leverage demand, which typically lifts perp funding/positioning and accelerates breakouts when price reclaims key levels. If LIT holds above ~$2.60 and reclaims ~$2.80, crowded shorts are forced to cover, pushing price toward the next fib zone (~$3.29).
Key Risk: Funding/positioning flips bearish fast (market turns risk-off or liquidity thins), causing a sharp liquidation cascade that drags LIT back under ~$2.30.
- LIT reached a five-month high amid strong buying momentum.
- A revamped tokenomics and a surge in holders supported the rally.
- Technical charts put $2.80 as the next key resistance and $2.30 as support.
Lighter has climbed to a five-month high after its LIT token rallied to around $2.73, extending gains of more than 20% over the past 24 hours as a series of protocol updates and ecosystem developments boosted investor interest.
According to CoinGecko data, LIT traded near $2.64 at the time of writing after reaching an intraday high of about $2.73, with the token posting gains of roughly 55% over the past week and nearly 90% over the past month.
The rally gathered pace after Robinhood announced on July 2 that it had integrated Lighter Perps into Robinhood Wallet, giving users direct access to the protocol's on-chain perpetual futures exchange.
The announcement sent LIT up about 24% in a single day as traders anticipated fresh retail participation through the wallet.
Support for the rally also came from a major change to the protocol's token economics.
On July 1, Lighter introduced a permanent burn policy under which all future tokens repurchased using protocol revenue will be destroyed instead of being retained.
After the end of the second quarter, the protocol said it would permanently burn about 15.5 million LIT tokens, representing roughly 6.3% of the current circulating supply of 250 million tokens.
At the same time, traders have increasingly compared Lighter with larger decentralised perpetual exchanges such as Hyperliquid.
The narrative circulating across the market argues that Lighter's market capitalisation, estimated at roughly $540 million (approx. Rs 151 billion) to $590 million (approx. Rs 165 billion), leaves room for further upside given its application-specific zk-rollup infrastructure and growing derivatives activity.
Additional interest has come from the protocol's recently published Q3 2026 roadmap.
The update outlines plans to expand supported collateral beyond stablecoins to include tokenized gold, Bitcoin, equities and native LLP tokens, while also introducing risk-based portfolio margining for correlated positions to improve capital efficiency for larger traders.
At the same time, on-chain participation has also continued to grow.
According to Token Terminal data, Lighter had surpassed 5,200 token holders while its cap table had nearly doubled over the past quarter.
Will the LIT rally continue?
Technical indicators continue to point to strong momentum, although the latest move has begun to cool after the sharp run-up.
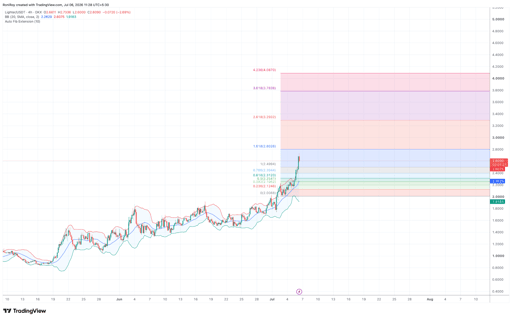
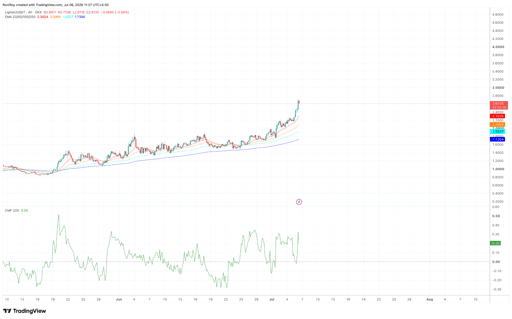
On the 4-hour chart, LIT remains above its 20, 50, 100, and 200 exponential moving averages, with the shorter-term averages positioned above the longer-term ones.
LIT/USDT 4-hour price chart. Source: TradingView.
This alignment is generally viewed by technical analysts as confirmation that the prevailing uptrend remains intact.
Although the token pulled back after touching nearly $2.73, buying pressure has not disappeared.
LIT/USDT 4-hour price chart. Source: TradingView.
The Chaikin Money Flow indicator remains in positive territory at around 0.20, indicating that capital inflows continue to outweigh outflows despite recent profit-taking.
The Bollinger Bands chart also shows LIT briefly trading above the upper band before retreating, a pattern often associated with strong momentum followed by short-term cooling after an extended move.
Fibonacci extension levels identify several potential resistance zones if the uptrend resumes.
The first major technical target sits near the 1.618 extension around $2.80, while higher extension levels are located near $3.29, $3.78, and $4.09.
These levels represent potential upside objectives used by technical traders rather than guaranteed price targets.
At the same time, the charts indicate nearby support around the 20-day exponential moving average near $2.30, followed by the 50-day exponential moving average around $2.10, should selling pressure increase.
For now, the $2.80 Fibonacci extension stands out as the next technical level traders are watching.
A sustained move above it could open the door to the $3.29 region, while failure to hold above the $2.50-$2.60 area may shift attention back to support near the 20 EMA around $2.30.

Is MORPHO’s 4% slide a buying chance after Morpho’s $175M funding round?

Can Bitcoin maintain momentum above $63K?

Evening digest: European stocks hit records, Bitcoin tops $62K

Bitcoin tops $62K as whales buy $16.7B while ETF outflows hit record

Solana breaks above $80 as institutional push lights up SOL rally
No results found
Loading articles...
Failed to load articles. Please try again.
