
Solana bulls defend $76 as fading inflows threaten another breakdown

AI Sentiment: 22/100 Bearish
This score is generated through AI-driven analysis of the article's content.

powered by

Buy SOL only if it holds the $76.67–$76.92 support zone and reclaims $83.94 on a daily close. The article flags fading inflows and weakening leverage, so the edge is buying the exact “line in the sand” where forced selling should exhaust; a reclaim of $83.94 signals institutions/spot demand is stabilizing and the bearish structure is breaking.
Key Risk: A daily close below $76.67/$76.92 that triggers a fast move to ~$60 support (trend resumes lower).
Sell/short SOL if it breaks and holds below $76.67–$76.92. With MACD nearing a bearish crossover and RSI at 43, the setup is a momentum continuation trade: ETF outflows + falling open interest usually mean less dip-buying and more leverage unwinds. Target ~$60.13 after the breakdown.
Key Risk: SOL quickly reclaims $83.94 and invalidates the breakdown, forcing shorts to cover.
- Solana’s SOL has slightly recovered to $78 after Wednesday’s bearish performance.
- Institutional demand weakened as SOL ETF outflows topped $8.67 million.
- Solana could retest $60 demand zone if retail and institutional demand remain weak.
Solana has slightly recovered following the heavy selling pressure on Wednesday. The coin dipped 3% on Wednesday amid strong bearish momentum.
The bearish trend was due to the weakening institutional inflows and declining activity in the derivatives market. This suggests that both institutional and retail investors are becoming increasingly cautious.
The broader risk-off sentiment across the cryptocurrency market has further weighed on SOL's short-term outlook.
SOL ETF outflows show declining institutional demand
Institutional demand for Solana eased significantly this week.
According to CoinGlass data, spot Solana exchange-traded funds (ETFs) recorded $8.60 million in net outflows on Wednesday, nearly wiping out the inflows reported on Monday and Tuesday.
Although institutional investors continue allocating capital to SOL, the slowdown indicates buying momentum has weakened compared with earlier in the week.
If ETF outflows continue to soften, Solana could struggle to regain upward momentum.
Activity in Solana's futures market also points to declining trader confidence. Data from CoinGlass shows that Open Interest fell 1.4% over the past 24 hours to $5.3 billion (approx. Rs 1.5 trillion).
The Futures trading volume declined 11.7% to $7.7 billion (approx. Rs 2.1 trillion), while the funding rates improved from -0.0042% to 0.0029%, indicating sentiment has shifted slightly positive but remains largely neutral.
The combination of falling Open Interest and fluctuating funding rates suggests many leveraged traders are reducing exposure while waiting for a clearer market direction.
Solana technical analysis: Key support under pressure
The technical analysis shows that Solana is still trading within a bearish structure after failing to break above a long-term descending resistance line near $83.94.
The cryptocurrency also remains below its 200-day Exponential Moving Average (EMA) at $95.51, keeping the broader trend neutral to bearish.
The most important support currently sits around the 50-day EMA at $76.67 and the 50% Fibonacci retracement at $76.92
This area represents a major technical support zone.
A decisive daily close below these levels would likely increase selling pressure and expose the next major support around $60.13, the lower demand zone.
Such a move would represent a decline of approximately 22% from current price levels.
Technical indicators also suggest bullish momentum is fading.
The Moving Average Convergence Divergence (MACD) is approaching a bearish crossover as the MACD line moves closer to its signal line, indicating weakening buying pressure.
Meanwhile, the Relative Strength Index (RSI) has slipped to 43, reflecting a growing bearish momentum.
Unless buyers regain control soon, these indicators could strengthen the bearish outlook.
If Solana manages to stabilize, bulls will need to overcome several resistance zones before a sustained recovery can develop.
The bulls would need to surge past the $83.94 key resistance level to enable them to target the 200-day EMA at $95.51
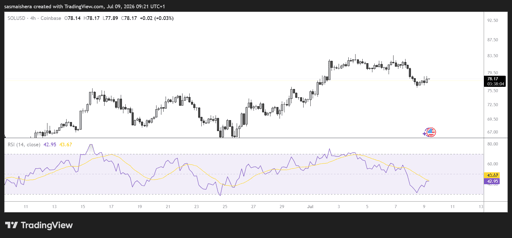
A successful breakout above the descending trendline would improve the short-term outlook and could pave the way for a move toward the 200-day EMA.
Until then, Solana remains vulnerable to additional downside, particularly if broader cryptocurrency market sentiment continues to weaken.

Crypto stocks MARA, COIN, Strive, MSTR rally as a bull run starts, but risks remain

Ethereum gains 25% as ETF demand strengthens after record $3B short wipeout

Crypto rally today: Why are XRP, Dogecoin, Cardano, Pepe going up?

Bitcoin surges past $76K as buyers pile in: is real demand taking over now?

SOL surges past $90 as ETF flows turn stronger: is a run toward $100 underway?
No results found
Loading articles...
Failed to load articles. Please try again.