
USD/ZAR forecast: falling wedge points to a South African rand pullback
AI Sentiment: 62/100 Bullish
This score is generated through AI-driven analysis of the article's content.

powered by

Buy South African front-end rate exposure (e.g., long JIBAR futures or long SA government bond duration via ZAR bond ETF/CFD). The setup is SARB credibility: inflation is above target and the central bank has already hiked to 7%, with more hikes hinted. Higher expected SA rates should strengthen ZAR and lift local bond prices relative to USD funding costs.
Key Risk: SARB is forced to cut or pause due to growth shock, making rate expectations fall and crushing the duration/rates thesis.
Sell USD/ZAR (short USD/ZAR spot or buy ZAR via USDZAR inverse ETF/CFD). The falling wedge suggests a bullish move for ZAR, and the article flags rand pressure easing after the crude spike. With SARB likely forced to hike later, carry demand should improve, and the pair is consolidating near key EMAs—ripe for a downside break if US inflation doesn’t re-accelerate.
Key Risk: US inflation prints hot and the Fed turns clearly hawkish, pushing USD higher and breaking the wedge to the upside.
- The USD/ZAR pair remained under pressure in the past few weeks.
- The rising oil prices may negatively impact the South African economy.
- SARB has hinted that it may need to hike rates again.
The USD/ZAR exchange rate rose by a few pips today, July 9, as crude oil prices rose following the new strikes in the Middle East. It jumped to 16.50 on Wednesday and then pulled back a bit to 16.37.
South African rand falls as geopolitical tensions rise
The South African rand softened a bit after the US and Iran restarted their strikes, with President Donald Trump declaring the truce over. As a result, crude oil prices jumped as investors anticipated more traffic disruptions at the Strait of Hormuz.
This disruption will happen at a time when inventories in the US and other countries remain at dangerously low levels. Indeed, Trump noted that worries in the oil market were one of the reasons why he decided to reach a one-sided deal with Iran.
Rising oil prices will make the South African inflation situation worse and push the central bank to intervene. The most recent data showed that the headline CPI jumped 4.5% in may from 3% in February. It has remained above the central bank’s target level since March this year.
In a statement at the European Central Bank (ECB) forum in Portugal, the head of South Africa’s central bank hinted that the bank may be forced to hike interest rates later this year. The bank has already hiked rates to 7% this year, with market participants expecting at least one more.
The South African rand has also struggled because of the ongoing developments in the metals industry. Gold, a key South African export, has plunged to $4,080, down by 27% from its highest point this year. Platinum and palladium prices have also pulled back.
Federal Reserve may hike rates this year
Meanwhile, there are signs that the Federal Reserve will hike interest rates this year. Fed minutes released on Wednesday showed that the committee entertained different scenarios in the last meeting.
Some members supported a view where the bank started cutting rates later this year, contigent on falling inflation. Others, however, supported hiking rates later, citing the elevated inflation, which has remained above the 2% target for a while.
Fed and SARB policies have an impact on the USD/ZAR pair because of the carry trade situation. The rand normally attracts more demand whenever the SARB is hiking rates as that makes it more attractive.
Looking ahead, the next main catalyst for the USD/ZAR pair will be the upcoming US inflation report coming out next week.
USD/ZAR technical analysis
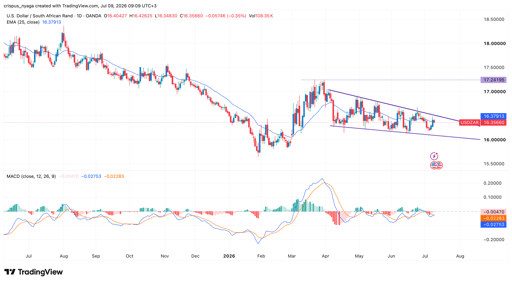
USDZAR chart | Source: TradingView
The daily chart shows that the USD/ZAR pair has come under pressure in the past few months. It has dropped from a high of 17.25 on March 23rd to the current 16.35.
The pair is now consolidating at the 25-day and 50-day Exponential Moving Averages (EMA). It also formed a falling wedge pattern, which is made up of two descending and converging trendlines.
This wedge pattern normally leads to a strong bullish breakout. If this happens, the next level to watch will be the psychological point of 17. A drop below the lower side of the wedge will point to more downside.

AMD stock forecast: why this Nvidia rival is on the cusp of a breakout

Blue Owl stock may short squeeze as golden cross emerges amid turnaround

Nvidia stock analysis as it evolves into a “central bank” of the AI industry

DocuSign stock forms golden cross as Morgan Stanley boosts target

Kospi Index nears an inflection point as South Korean won jumps
No results found
Loading articles...
Failed to load articles. Please try again.