
Will Bitcoin break above $65,000 once again?

AI Sentiment: 58/100 Bullish
This score is generated through AI-driven analysis of the article's content.

powered by

Buy BTC (spot or BTC-USD perpetuals) for a retest and break of $65,000–$65,070 (50-day EMA). Softer US inflation (CPI/PPI) pushed rate-cut expectations out, and spot BTC ETFs pulled in $180M+ net inflows—real demand, not just trading. Technicals: higher lows on the 4-hour chart and RSI ~56 show momentum without being overheated. Upside magnet: liquidity/short-liquidation pocket at $65,700–$66,000.
Key Risk: Geopolitical escalation or a renewed risk-off shock that drags BTC back below $64,100 and breaks the $63,300–$63,800 support zone.
Sell BTC (or buy BTC puts) if price rejects $65,070–$65,500 and fails to hold above the 50-day EMA. The article flags heavy leveraged short liquidations above $65,700, but that also means the market is crowded—if the breakout fails, leverage unwinds fast and can push BTC back into the $64,100–$64,300 value area, then $63,600–$63,800.
Key Risk: A clean daily close above the 50-day EMA that triggers sustained short covering and accelerates BTC toward $67,200–$68,400.
- Bitcoin briefly topped $65,000 before geopolitical tensions erased the gains.
- Softer US inflation data and $180 million in ETF inflows fueled the rally.
- Resistance sits near $65,700, with support around $64,100.
Bitcoin briefly climbed back above $65,000 before giving up those gains as softer US inflation data boosted risk appetite, but renewed geopolitical uncertainty capped the rally.
According to CoinGecko data, Bitcoin BTC rose to an intraday high of $65,500, its strongest level since June 22, before retreating to around $64,500-$64,800 during Thursday's Asian trading session.
The move came after the US Bureau of Labor Statistics reported that the June Producer Price Index (PPI) fell 0.3% month over month, while annual producer inflation stood at 5.5%.
The agency said the monthly decline was driven by a 1.4% drop in final demand goods prices, even as final demand services increased 0.2%.
Only a day earlier, US consumer inflation had also surprised markets after the Consumer Price Index (CPI) declined 0.4% in June, prompting traders to reassess expectations for Federal Reserve policy.
The latest readings from CME Group's FedWatch Tool also indicated markets had become less convinced that the Federal Reserve would raise rates by 25 basis points at its September meeting.
Meanwhile, institutional demand added another layer of support after spot Bitcoin exchange-traded funds attracted more than $180 million in net inflows following the CPI release, reinforcing the move above the $64,000 resistance area.
Geopolitical tensions erased part of the rally
Bitcoin's advance lost momentum later in the session after renewed geopolitical uncertainty weighed on broader risk sentiment.
Iran's Foreign Ministry said the country currently has no plans to resume negotiations with the United States and remains focused on its defense efforts.
The statement contradicted comments from US President Donald Trump, who had said during a FOX interview that Iran wanted to reach a deal and had already reached out.
The conflicting statements arrived as military operations between the two countries continued.
Trump also warned Washington could expand military action if Tehran refused to negotiate while maintaining the US blockade around the Strait of Hormuz.
Those developments pushed Bitcoin back below $65,000, interrupting the rally sparked by the favorable inflation reports.
Bitcoin price analysis
On the daily chart, Bitcoin continues trading above its 20-day EMA near $63,350, indicating buyers have maintained short-term control despite the latest pullback.
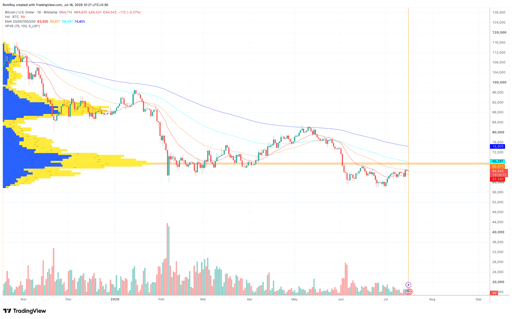
BTC/USD 1-day price chart. Source: TradingView.
However, the price remains below the 50-day EMA around $65,070, leaving that area as the first major resistance.
Above it, the 100-day EMA near $68,390 and the 200-day EMA around $74,400 remain longer-term barriers.
The Volume Profile Visible Range (VPVR) shows one of the highest trading activity zones between $63,000 and $65,000, suggesting this area has become an important value region where buyers and sellers continue to compete.
The 4-hour chart presents a constructive picture. Bitcoin has formed a series of higher lows since early July, while the Relative Strength Index (RSI) sits near 56, indicating positive momentum without entering overbought territory. See below.
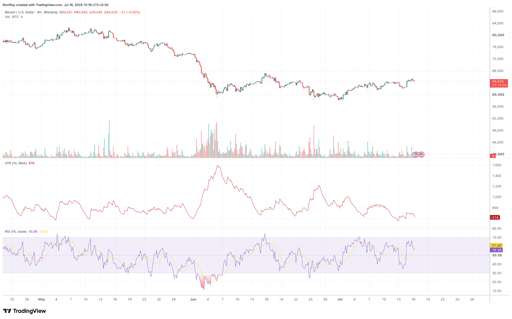
BTC/USD 4-hour price chart. Source: TradingView.
At the same time, the Average True Range (ATR) has eased from June's elevated readings, pointing to lower volatility following the inflation-driven rally.
Liquidation data from CoinGlass shows another reason why Bitcoin has struggled to hold above $65,000.
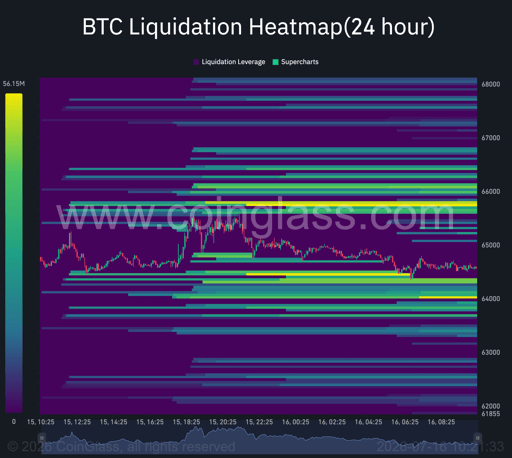
Bitcoin 24-hour liquidation heatmap. Source: Coinglass.
The largest concentration of leveraged short liquidations sits between $65,700 and $66,000.
A sustained move into that zone could trigger forced short covering and accelerate a rally toward $67,200, matching the liquidity level identified by Daan Crypto Trades.
Support remains clustered around $64,100-$64,300, where the heatmap shows a sizeable pool of leveraged positions.
If that area fails, another concentration of liquidity around $63,600-$63,800 could become the next downside target, with the 20-day EMA offering additional technical support nearby.
The charts indicate Bitcoin remains in a consolidation phase after its inflation-driven rebound.
A daily close above the 50-day EMA could strengthen the case for a move toward $67,200-$68,400, while a break below $64,100 would increase the likelihood of another test of the $63,300-$63,800 support region.

Can HYPE reclaim $90 after bouncing from $77?

Zcash price slips from $1,300: could ZEC fall to $850 before targeting $2,500?

CLARITY Act Senate vote on Tuesday: what to expect

Ethereum’s breakout setup is getting harder to ignore as bulls press $2,550

Why XRP may need more than ETF inflows to break above $1.40
No results found
Loading articles...
Failed to load articles. Please try again.