
Bitcoin under pressure as US–Iran tensions and ETF outflows weigh on price

AI Sentiment: 18/100 Bearish
This score is generated through AI-driven analysis of the article's content.

powered by

Sell BTC (spot or BTC perpetuals). News is a double hit: US–Iran escalation risk is worsening global risk sentiment, and US spot BTC ETF outflows (~120k BTC in 2026) show institutions are still net sellers. Technicals confirm: BTC is below all key EMAs (10/20/50/100/200), and it failed to hold above the $65k area, keeping the bearish structure intact. Key trigger: rallies into ~$64.4k–$65.5k resistance are likely to be sold.
Key Risk: A daily close back above ~$65,600 that flips the trend and is followed by renewed ETF inflows.
Sell ETH (spot or ETH perpetuals). The article flags similar institutional caution: spot Ethereum ETFs are seeing net outflows (~$28m recently), ending a brief inflow streak. With BTC weak and ETH typically beta-linked, ETH should underperform on any risk-off continuation. Technicals aren’t detailed, but the macro + ETF flow setup is the same bearish driver.
Key Risk: ETH ETF inflows re-accelerate while BTC stabilizes, forcing a risk-on rotation into ETH.
- BTC trades near $63K while key support holds at $61,884.
- US spot Bitcoin ETFs have seen 120,000 BTC exit in 2026.
- Crypto Fear and Greed at 31 signals deeply cautious market sentiment.
Bitcoin remained under pressure on Friday as geopolitical tensions in the Middle East and weakening institutional demand combined to keep the world's largest cryptocurrency below key technical resistance.
While the broader crypto market has shown resilience in recent months, the latest price action suggests traders are becoming increasingly cautious as macroeconomic uncertainty grows.
At the time of writing, Bitcoin BTC was trading at $63,129.65, down 1.55% over the previous 24 hours.
The cryptocurrency is trading between $62,640.04 and $64,821.37, extending a period of consolidation after failing to sustain momentum above the $65,000 region.
Geopolitical tensions add to market uncertainty
Bitcoin's latest decline coincided with renewed military exchanges between the United States and Iran, prompting investors to reduce exposure to risk assets across global markets.
The US-Iran war has weighed not only on cryptocurrencies but also on broader financial markets, with risk sentiment deteriorating as concerns over further escalation intensified.
Analysts have also been monitoring the potential impact on global energy supply routes, particularly around the Red Sea, where disruptions could increase volatility across commodity and financial markets.
The latest sell-off briefly pushed Bitcoin back below the psychologically important $63,000 level after the asset was rejected near $65,600 earlier in the week.
The inability to establish support above $65,600 has reinforced the current short-term bearish structure.
ETF outflows continue to reflect cautious institutional sentiment
Institutional demand has also weakened compared with previous quarters.
Data highlighted by CryptoQuant analyst Darkfost shows that US spot Bitcoin exchange-traded funds (ETFs) have experienced approximately 120,000 BTC in net outflows in 2026.
BTC is entering a critical moment today, one that is creating doubt and putting real pressure on some investors.
— Darkfost (@Darkfost_Coc) November 16, 2025
That’s why I want to take a moment to walk through the current situation together, exactly as I see it through the data I work with every single day and that I’ve… pic.twitter.com/LighS2IdQ3
Since Bitcoin reached its record high in October 2025, cumulative ETF outflows have reportedly exceeded 160,000 BTC, indicating that institutional investors have reduced exposure throughout much of the year.
Although there have been isolated sessions of positive inflows, the pace has slowed considerably.
Recent daily inflows of around $79 million followed stronger inflows of approximately $108 million and $181 million in the preceding sessions, suggesting that institutional buying has become less consistent.
Ethereum has experienced a similar trend. Spot Ethereum ETFs recently recorded roughly $28 million in net outflows, ending a brief period of positive flows and reflecting broader caution among institutional investors.
Technical indicators continue to favour the bears
Bitcoin's technical picture remains under pressure despite signs that selling momentum has slowed.
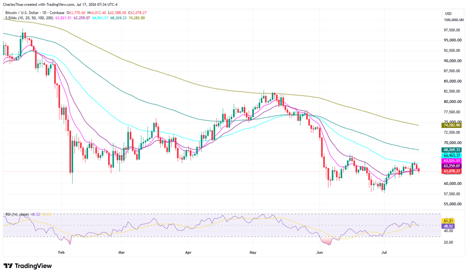
The first resistance level traders are watching sits at $64,413. A daily close above that level would improve the near-term structure and could open the door for a move toward the next resistance at $65,536.
On the downside, the first important support is located at $61,884.
A sustained break below that level would increase the likelihood of a deeper correction, with the $57,000 area emerging as the next major support zone.
The broader trend also remains weak from a moving average perspective.
Bitcoin is currently trading below its 10-day, 20-day, 50-day, 100-day, and 200-day exponential moving averages, producing a strong bearish signal across both short- and long-term timeframes.
Trading below the 200-day EMA, in particular, indicates that broader market pressure remains intact.
Momentum indicators, however, are less decisive.
The 14-day Relative Strength Index (RSI) stands at 48.52, placing Bitcoin in neutral territory.
This suggests the asset is neither overbought nor oversold, leaving room for price movement in either direction depending on incoming catalysts.
Market sentiment remains deeply negative
Investor sentiment has weakened alongside the recent decline in price.
The Crypto Fear & Greed Index currently stands at 31, placing the market firmly in Fear territory.
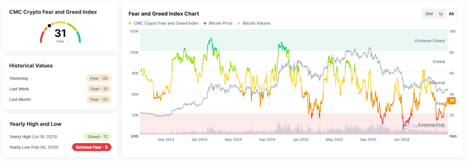
Such readings reflect widespread caution among investors and typically occur during periods of heightened uncertainty and elevated selling pressure.

Why XRP traders are watching $1.47 as Evernorth and ETF demand build pressure

ENA explodes 10% as Ethena moves to kill its biggest token overhang

Can Ethereum price reclaim $2,500 as ETF demand battles profit-taking?

Why is Strategy (MSTR) stock gaining 12% today

Bitcoin hits resistance with $2.9B in longs at risk below $68,000
No results found
Loading articles...
Failed to load articles. Please try again.