
Why is CORE price going down?
AI Sentiment: 18/100 Bearish
This score is generated through AI-driven analysis of the article's content.

powered by

Sell CORE (spot) or short CORE/USDT. The exploit hit Allbridge Core branding, but the market is treating it as a CORE token problem, and CORE is already in a bearish EMA stack (below 20/50/100/200). With price sitting on a thin support shelf near $0.024, any failure there opens $0.022–$0.023. Even if RSI is near-oversold, the headline overhang can keep buyers sidelined until the chart reclaims the 20-day EMA (~$0.0249).
Key Risk: CORE quickly regains the 20-day EMA and sentiment flips (no further confusion/liquidity-provider losses), turning the $0.024 support into a durable base.
Sell ALBT (or any Allbridge-linked token with similar branding exposure) and avoid related liquidity-provider tokens. The protocol was paused and LPs were asked to withdraw from affected pools—this is direct ecosystem damage, not just a rumor. Expect continued liquidity fragmentation and slower capital rotation into the ecosystem until the investigation ends and funds are returned.
Key Risk: Allbridge restores normal operations fast, confirms limited losses, and returns funds/LPs without further incidents, causing a sharp risk-on rebound in the ecosystem.
- CORE fell to around $0.024 after the Allbridge Core exploit sparked confusion.
- CORE hovered near its daily low with momentum still favoring sellers.
- The price is hovering close to oversold territory on the 4-hour chart.
CORE has fallen to around $0.024, trading between $0.02387 and $0.02449 over the past 24 hours, after a $1.7 million (approx. Rs 461.3 million) exploit targeting the Allbridge Core cross-chain bridge weighed on market sentiment.
CoinGecko data showed the token was down about 1.4% over the past day, extending losses to 0.9% over the past week, 5.6% over two weeks, and 9.7% over the last month.
Although the attack did not involve the Core blockchain or its native CORE token, the similarity in branding appears to have caused confusion among some market participants.
Selling pressure increased as news of the exploit spread, adding to an already weak technical setup for the token.
The incident prompted Allbridge to pause its Allbridge Core protocol and ask liquidity providers to withdraw funds from affected pools while the investigation continues.
According to on-chain analytics platform Onchain Lens, the attacker used a $1.12 million USDC flash loan from Kamino to manipulate Allbridge Core's USDC/USDT liquidity pool, eventually draining about $1.7 million (approx. Rs 461.3 million) before moving the funds from Solana to Ethereum through privacy protocols.
During its investigation, Allbridge said the exploit temporarily created an arbitrage opportunity and asked anyone who profited from it to voluntarily return the funds to help compensate affected liquidity providers.
Even though CORE was not directly affected by the breach, the incident occurred as the token was already trading in a prolonged downtrend.
The combination of negative headlines, cautious investor sentiment, and an already fragile chart structure appears to have amplified the latest decline.
CORE price analysis
Although the exploit did not involve the Core blockchain, the token has remained under pressure as negative sentiment coincided with an already fragile technical setup.
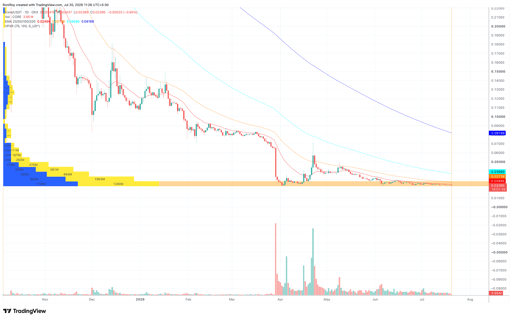
On the daily chart, CORE continues to trade below its 20-day, 50-day, 100-day and 200-day exponential moving averages, a bearish alignment that indicates sellers remain in control of the longer-term trend.
CORE/USDT 1-day price chart. Source: TradingView.
The 20-day EMA sits near $0.0249, followed by the 50-day EMA around $0.0274, placing immediate resistance above the current market price.
The Volume Profile Visible Range (VPVR) shows heavy historical trading activity around the $0.024 region.
That makes the current area an important support zone, as buyers have previously accumulated positions there.
If this level fails to hold, the chart shows relatively thinner traded volume below, increasing the possibility of a move toward the $0.022-$0.023 range before stronger buying interest emerges.
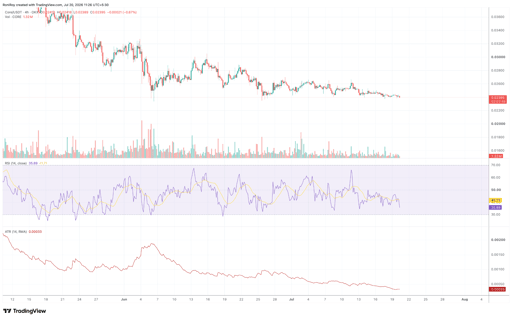
Meanwhile, the 4-hour chart points to weakening momentum rather than aggressive selling.
CORE/USDT 1-day price chart. Source: TradingView.
The Relative Strength Index (RSI) has slipped to about 36, approaching oversold territory but remaining above the 30 threshold that often signals exhaustion among sellers.
The Average True Range (ATR) has continued to decline, indicating daily price swings have narrowed since the earlier selloff.
Falling ATR alongside a subdued RSI suggests volatility has cooled even though bearish pressure remains.
For buyers to regain control, CORE would first need to reclaim the 20-day EMA near $0.0249 and then clear resistance around $0.0274, where the 50-day EMA currently sits.
Until then, the charts indicate the token remains vulnerable to additional downside if selling pressure linked to the exploit-driven sentiment continues.

Ethereum slips toward $2,400: key ETH levels to watch if support breaks

Can ARB price reach $0.14 after 30% rally powered by Robinhood chain?

BONK jumps 7% as rising futures demand supports a breakout attempt

Robinhood stock rises as Morgan Stanley upgrades HOOD to overweight

XRP price slips despite 10-day ETF inflow streak: is a breakout still coming?
No results found
Loading articles...
Failed to load articles. Please try again.