
Bitcoin at $63K ahead of CPI: is this a dip to buy or a warning sign?

AI Sentiment: 28/100 Bearish
This score is generated through AI-driven analysis of the article's content.

powered by

Buy BTC only if it holds $63,676 and reclaims the 50-day EMA at $64,583 on a daily close. Setup: fear sentiment (37) + weak momentum (RSI <50, MACD below signal) means dips can be bought, but only after price proves support. Why: a CPI-driven “disinflation” print should weaken rate-hike odds and let BTC squeeze back through the key moving-average wall toward $65,312 then $66,736. Key risk: CPI comes in hot and revives rate-hike fears, breaking $63,676 and accelerating toward $61,307.
Key Risk: Hot CPI that breaks $63,676 and pushes BTC toward $61,307.
Sell BTC exposure into strength by buying 1–3 month BTC put spreads (or selling call spreads) around the $64,600–$65,300 area. Setup: BTC is below all major EMAs and momentum is still bearish; CPI is the catalyst that can flip quickly. Why: you monetize the skew toward downside if CPI surprises hot, while still benefiting if BTC chops and fails to reclaim $64,583/$65,312. Key risk: CPI is clearly cooler than expected and BTC reclaims $64,583, then runs through $65,312, crushing put-spread value.
Key Risk: CPI is cooler than expected and BTC reclaims $64,583/$65,312, making puts lose value.
- Bitcoin remains below $64,000 amid cautious sentiment across crypto market.
- CoinMarketCap’s Fear and Greed Index stands at 37, indicating persistent fear.
- A close below support at $63,676 could trigger a decline toward $61,307.
Bitcoin BTC is trading below $64,000 at the time of writing on Wednesday as a broader risk-off mood continues to weigh on the cryptocurrency market.
Investor sentiment remains cautious, with CoinMarketCap’s Fear and Greed Index registering 37.
The reading places the market in the “fear” category, suggesting traders remain reluctant to increase their exposure to volatile assets.
The bearish performance comes ahead of Wednesday’s US inflation report, which could determine whether BTC breaks toward $70,000 or extends its decline.
BTC underperforms ahead of core inflation data
Bitcoin is down by roughly 1% in the last 24 hours and is now trading around $63,600 per coin.
The bearish performance comes as traders await the Consumer Price Index (CPI) data release later today.
Last week’s unexpected contraction in US payrolls reduced the probability of a September interest-rate hike to around 44%, down from roughly 80% in late July.
Analysts expect headline US inflation to ease to 3.4% year over year, while core inflation is forecast to decline to 2.5%.
However, a softer-than-expected reading could reinforce the disinflation narrative created by last week’s disappointing employment report.
That outcome would likely weaken expectations for further monetary tightening and support risk assets such as Bitcoin.
Finally, a hotter reading could trigger the opposite reaction, reviving interest-rate concerns and pressuring cryptocurrency prices.
Bitcoin remains below key moving averages
Bitcoin maintains a bearish near-term outlook as it trades below several important Exponential Moving Averages (EMAs).
The 50-day EMA at $64,583 represents the first significant dynamic resistance level. Above it, the 100-day EMA at $66,736 and the 200-day EMA at $72,190 reinforce the broader bearish structure.
With all three averages positioned above the current price, sellers retain a technical advantage. Bitcoin would need to reclaim these levels progressively to establish a stronger recovery and signal a meaningful change in trend.
Until then, rebounds may continue to encounter selling pressure around the key moving averages.
Bitcoin is trading marginally above a short-term ascending support trendline near $63,676.
This level is critical to the immediate outlook because it has helped contain the latest decline.
A decisive daily close below the trendline could confirm a bearish breakdown and increase the likelihood of further losses.
In that scenario, Bitcoin could fall toward the July 6 low of $61,307. Buyers may attempt to defend this level, but a breakdown below it would deepen the correction and reinforce the bearish market structure.
Conversely, a rebound from $63,676 could help BTC retest the 50-day EMA at $64,583.
Bitcoin’s momentum indicators suggest that buying pressure remains limited.
The Relative Strength Index is hovering near 48, below its neutral midpoint of 50.
This position shows that neither buyers nor sellers have established overwhelming control, although bears maintain a modest advantage.
The Moving Average Convergence Divergence indicator has also slipped marginally below its signal line. The move signals weakening bullish momentum and suggests buyers lack the conviction required to drive a sustained recovery.
Further declines in both indicators could strengthen the bearish outlook, while an RSI recovery above 50 and a bullish MACD crossover would indicate improving demand.
On the upside, Bitcoin’s first obstacle is the 50-day EMA at $64,583.
A daily close above this average could reduce immediate selling pressure and allow BTC to test a descending resistance trendline around $65,312.
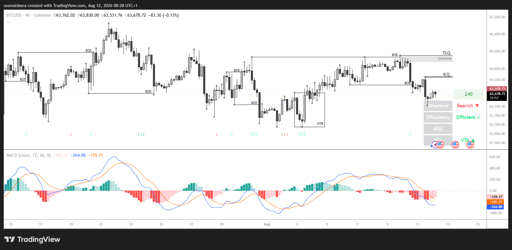
This trendline has capped several recent recovery attempts, making it an important breakout level.
Clearing $65,312 could encourage sidelined buyers to return and open the path toward the 100-day EMA at $66,736.
However, failure to reclaim the 50-day EMA would keep Bitcoin vulnerable to another test of the $63,676 support trendline. A break below that level could extend the decline toward $61,307.

SHIB is down nearly 23% from its August high: can buyers stop the slide?

Zcash slips below $500 as traders brace for a major CPI-driven move

Solana gets MoneyGram boost as ETF buyers return: can SOL break $80?

XRP buyers are defending $1, but charts are flashing a warning

TRX price is breaking out: can TRON’s stablecoin boom push it to $0.35?
No results found
Loading articles...
Failed to load articles. Please try again.