
How high can PI price go as Protocol 27 upgrade nears?

AI Sentiment: 72/100 Bullish
This score is generated through AI-driven analysis of the article's content.

powered by

Buy PI. The market is already positioning for Protocol 27, and price action is rebuilding higher lows while holding above the key 4-hour support zone ($0.0930–$0.0935) with momentum back above zero. If PI gets a 4-hour close above $0.0939, the $0.095–$0.096 area should open up, then $0.098–$0.100.
Key Risk: Protocol 27 disappoints (or is delayed) and PI breaks back below $0.0930, killing the higher-low structure and triggering a fast move toward $0.091–$0.083.
Buy OUSD. The article notes OpenPay restored Cash-In, but payments still require converting PI into OUSD—so incremental usage should flow into OUSD balances even if PI demand is capped. As Protocol 27 improves smart-contract/authentication and more infrastructure runs via SoloHost, more users will likely route value through the PI→OUSD step, supporting OUSD relative strength.
Key Risk: OUSD usage doesn’t rise because Cash-In/fiat access remains limited or users keep holding PI instead of converting, causing OUSD to lag and unwind the thesis.
- PI price has risen 2.6% over the past 24 hours to roughly $0.0934.
- Protocol 27 expectations are supporting the price move.
- A break above $0.0989 could put $0.102 and $0.1065 in focus.
PI price has risen 2.6% over the past 24 hours to roughly $0.0934 as traders position ahead of Pi Network’s expected Protocol 27 upgrade on Sept. 15.
CoinGecko puts PI at $0.09337 at the time of writing, with the token also up 4% over the past seven days, 8.4% in two weeks and 13.7% over the past month.
The latest move extends a gradual recovery from $0.0892 on Aug. 25, although PI remains down more than 72% over the past year.
Expectations around Protocol 27 have provided the main catalyst for the latest price move.
Pi Network completed Protocol 26 in August and is approaching the next planned upgrade, which is expected to improve smart contract functionality and authentication.
Development work around decentralised exchange and automated market maker infrastructure has also added to expectations surrounding the upgrade.
With Sept. 15 less than two weeks away, the prospect of more applications being built on the network has given traders a specific event to watch.
Pi Network has also expanded the software available through SoloHost on Pi Desktop.
According to the project’s official blog, OpenClaw and Atlassian MCP Server were recently added to the platform, allowing node operators to run more self-hosted applications locally.
The additions followed the August release of Pi Node version 0.6.2 and earlier improvements to SoloHost.
While the applications do not directly create demand for PI, they expand the functions available to people running Pi infrastructure.
OpenPay has separately restored its Cash-In feature, adding another fiat access option to the Pi-related payments ecosystem.
Payments still require PI to be converted into OUSD, which limits the feature’s direct effect on demand for PI itself.
The price move has so far remained relatively measured.
PI traded close to $0.0915 late on Sept. 1 before climbing sharply above $0.093 during the early hours of Sept. 2.
It later reached an intraday area near $0.0948 before settling around $0.0934.
PI price analysis
PI’s 4-hour chart has started forming higher lows since the Aug. 23 pullback, while the latest candles are holding around $0.0935. See below.
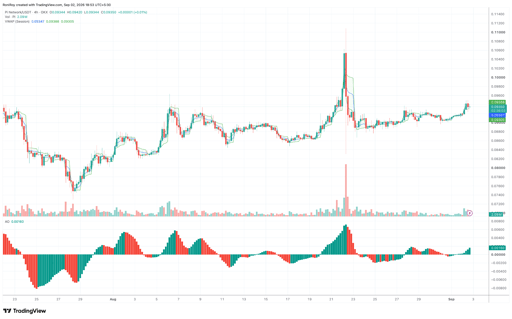
PI/USDT 4-hour price chart. Source: TradingView.
Price has also returned above the session VWAP at $0.09347, with the upper and lower VWAP bands sitting near $0.09388 and $0.09305.
Holding above the VWAP keeps $0.0930-$0.0935 as the immediate support zone.
A 4-hour close above $0.0939 would put the recent $0.095-$0.096 area back in play.
PI briefly traded much higher on Aug. 22, but the long wick from that session makes the spike towards $0.11 a less reliable resistance reference than the subsequent closing prices.
The Awesome Oscillator has climbed to roughly 0.00160, and its latest histogram bars are green and rising above zero.
The reading follows a brief dip around the zero line at the end of August, meaning short-term momentum has turned positive again as PI approaches $0.094.
A move through $0.095-$0.096 with the Awesome Oscillator continuing to expand above zero could open a path towards $0.098-$0.100.
Losing $0.0930 would weaken the current 4-hour structure, with $0.091-$0.092 becoming the next area to watch.
On the daily chart, PI has been building a base since dropping to roughly $0.071 in July.
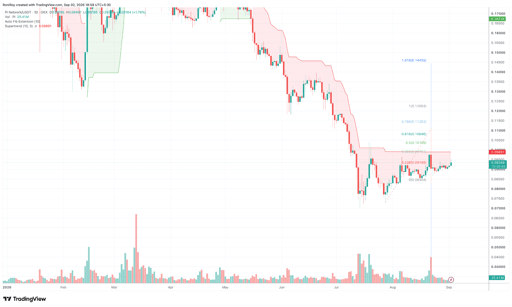
PI/USDT 1-day price chart. Source: TradingView.
The token has since produced a series of higher lows, including a recent swing low at $0.08304, but it remains below the Supertrend level at $0.09891.
A daily close above $0.0989 would flip the Supertrend from resistance and would also take PI through the psychological $0.10 level.
Until that happens, the indicator continues to place the larger daily trend below its bullish reversal threshold.
The Fibonacci extension drawn from the $0.08304 swing low places the 0.236 level at $0.09198, which PI has already moved above.
The next levels sit at $0.09751 for the 0.382 extension, $0.10199 at 0.5, and $0.10646 at 0.618.
A sustained break above $0.0989 would therefore bring $0.102 and $0.1065 into range.
If PI clears those levels, the 0.786 extension sits at $0.11282, followed by $0.12093 and the 1.618 extension at $0.14435.
Failure to hold above the 0.236 Fibonacci level at $0.09198 would put $0.090 back under pressure.
A break below that area could send PI towards the $0.08304 swing low, which remains the main invalidation level for the higher-low structure formed since July.

XRP dips to $1.32 despite 11-day spot ETF inflow streak

Bitcoin’s $82,000 test is coming as one major market signal turns bullish

Ethereum slips toward $2,400: key ETH levels to watch if support breaks

Can ARB price reach $0.14 after 30% rally powered by Robinhood chain?

BONK jumps 7% as rising futures demand supports a breakout attempt
No results found
Loading articles...
Failed to load articles. Please try again.