
Why is HYPE stalling near $90 even as ETF inflows refuse to turn negative?

AI Sentiment: 58/100 Bullish
This score is generated through AI-driven analysis of the article's content.

powered by

Buy HYPE only on a daily close above $89.61 (upper trendline). The token is still well above the 50/100/200-day EMAs, ETF flows are positive for a fifth straight week, and the only thing missing is a decisive move through the $90 resistance area (127.2% fib at ~$85.94 already being tested). This sets up a push toward $98.95 (161.8% fib) and then $100.
Key Risk: A confirmed break below $82.40 that turns the uptrend into a deeper selloff toward ~$76.93 and ~$71.55.
Sell/short HYPE if it rejects $89.61–$90 with a quick reversal (failed breakout). Momentum indicators are cooling (MACD slipped below signal; RSI ~58), and the article flags profit-taking near the $85.94–$90 zone. If buyers can’t reclaim the trendline, price is likely to mean-revert back to $82.40 support, then $76.93.
Key Risk: Price instead holds above $89.61 and closes higher, invalidating the rejection and forcing a run to ~$98.95/$100.
- Hyperliquid trades in the red on Monday after gaining 10% last week.
- HYPE ETFs attracted $12.27M last week, the fifth consecutive week of inflows.
- A close above $89.61 could send HYPE toward $98.95 and $100 in the near term.
Hyperliquid HYPE is trading in negative territory on Monday as its rally loses momentum following a 10% advance last week.
Demand for HYPE-focused exchange-traded funds remains positive, with the products recording their fifth consecutive week of net inflows.
However, the latest technical indicators suggest buyers may struggle to sustain the rally without a decisive breakout.
HYPE holds above $86 at the time of writing, retaining its broader bullish structure despite the modest pullback.
Major institutions disclose exposure to HYPE
Bloomberg ETF analyst James Seyffart shared data on X showing that several major financial institutions have exposure to HYPE-focused investment products.
NEW: Earlier this week i took a look at the Hyperliquid ETFs and their 13F reporting. Here's a look at all the known holders of the three ETFs. hyperliquid:native pic.twitter.com/99rcQ8bsFs
— James Seyffart (@JSeyff) September 4, 2026
The disclosed holders include Wealth High Governance, OLP Capital, UBS, Bank of Montreal, and Jane Street, among others.
The participation of established financial firms points to increasing institutional interest in Hyperliquid, a decentralized exchange whose native HYPE token is used throughout its ecosystem.
The disclosures come as discussions continue over bringing Hyperliquid-related products and services into the regulated US market.
HYPE-focused ETFs attracted $12.27 million in net inflows last week, according to CoinGlass.
Although that figure was sharply below the previous week’s $56.86 million, it marked a fifth consecutive week of positive flows.
The streak suggests institutional demand remains steady even as the pace of new investment slows.
Continued inflows may help support HYPE’s price, but the week-over-week decline indicates that investor enthusiasm has moderated following the token’s recent rally.
Hyperliquid technical outlook: HYPE remains above key moving averages
Hyperliquid’s price remains comfortably above its major exponential moving averages on the daily chart, supporting the broader bullish outlook.
The 50-day exponential moving average sits at $71.55, while the 100-day EMA is at $65.05. The 200-day EMA, currently near $56.64, provides longer-term support.
HYPE’s substantial distance above these indicators confirms an established uptrend. However, it also leaves the token vulnerable to a correction if investors continue taking profits.
Fibonacci retracement levels calculated from the recent swing between $51.20 and $76.93 remain below the current price, providing several potential support zones during a pullback.
HYPE is struggling to clear the 127.2% Fibonacci extension at $85.94 decisively, indicating increased selling pressure and profit-taking near current levels.
The Relative Strength Index stands near 58 on the 4-hour chart. Although the RSI remains in bullish territory, it has retreated from overbought levels, suggesting that buying momentum is cooling.
Meanwhile, the Moving Average Convergence Divergence indicator has moved marginally below its signal line. This crossover reinforces the possibility of a short-term loss of momentum.
Neither indicator confirms a full bearish reversal, but both suggest HYPE may consolidate or pull back before attempting another move higher.
HYPE is trading close to the recent support near $82.40. A confirmed break below this support could extend the correction toward $76.93.
If selling pressure intensifies, the token could fall toward the 50-day EMA at $71.55, close to the 78.6% Fibonacci retracements at $70.51.
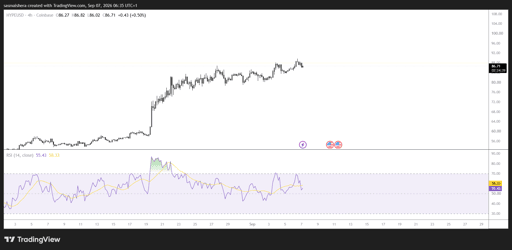
Conversely, a decisive daily close above the channel’s upper trendline near $89.61 would reinforce the bullish outlook.
Such a breakout could propel HYPE toward the 161.8% Fibonacci extension at $98.95. Clearing that level would bring the psychologically important $100 mark into focus.
For now, HYPE’s longer-term structure remains bullish, but weakening momentum and resistance near $90 could delay its attempt to reach triple digits.

Is Zcash setting up for $1,300 as ETF demand keeps squeezing short sellers?

Wall Street is pouring into Bitcoin ETFs: why BTC is still trapped below $80,000

Crypto price predictions: Dogecoin, XRP, Venice Token (VVV)

Zcash price prediction: Here’s why ZEC token has gone parabolic

ARB price prediction: How Robinhood Chain growth is boosting Arbitrum
No results found
Loading articles...
Failed to load articles. Please try again.