
PI coin rises ahead of Protocol 27, can it recover above $0.10?

AI Sentiment: 72/100 Bullish
This score is generated through AI-driven analysis of the article's content.

powered by

Buy PI. It’s pressing the $0.0971–$0.10 resistance with a strengthening trend (ADX ~41) and rising inflows (MFI ~68, CMF back above zero). A daily close above $0.10 should trigger a push to ~$0.1045, then the ~$0.11 spike area.
Key Risk: Protocol 27 slips or underdelivers, causing PI to fail at $0.10 and break back below ~$0.094 (trend damage).
Sell BTC and rotate into PI. The article shows PI rising while BTC is down (~-1.33% same period), suggesting capital is rotating into PI-specific catalysts ahead of Protocol 27. If BTC stays weak, PI’s relative strength should persist into the $0.10 breakout attempt.
Key Risk: BTC rebounds sharply (risk-on) and drags the whole market up, reversing the PI-vs-BTC rotation.
- PI has gained roughly 3% in 24 hours and is trading near $0.097.
- Protocol 27, scheduled for Sept. 15, remains the main catalyst behind the rally.
- PI needs to clear $0.097 to $0.10 to target $0.105 and $0.11.
PI Network has risen roughly 3% over the past 24 hours to trade near $0.097 on Sept. 8, putting the token within reach of $0.10 as its Protocol 27 mainnet upgrade approaches.
Coingecko price data puts PI at roughly $0.097, with the token trading between $0.0937 and $0.0969 over the past day.
PI has gained roughly 6% over seven days after starting September near $0.091.
The latest move has taken PI back towards $0.0971, a resistance area that has capped the price for roughly two months.
The token is holding above its 50-day exponential moving average near $0.094 while pressing against that resistance on Tuesday.
Protocol 27 remains the main event behind the recent interest in PI. Pi Network has targeted Sept. 15 for the upgrade to reach mainnet after deployment on Testnet 1 began in August.
The upgrade introduces more flexible smart contract authentication and lays infrastructure for RPC servers, decentralised exchange functions and automated market maker liquidity pools.
It follows Protocol 26, which required node operators to update their software before the network moved to the next protocol version.
PI has been rising while Bitcoin has struggled during the same period. As of Sept. 8 PI reached $0.0974 after gaining more than 4% over 24 hours while Bitcoin fell 1.33%, leaving the token's latest move tied more closely to developments within the Pi ecosystem.
Derivatives activity has also picked up alongside PI’s price recovery.
According to CoinAnk, PI coin’s futures open interest rose to $9.60 million from $9.20 million a day earlier, while Coinranking put the figure at $20.07 million on Sept. 7, up from $14.83 million on Sept. 1.
PI price analysis
PI's daily chart has formed a series of higher lows since its July bottom, with an ascending trendline now running beneath the price around the low-$0.09 region.
The token traded near $0.0962 at the latest reading after recovering from below $0.08 in July.
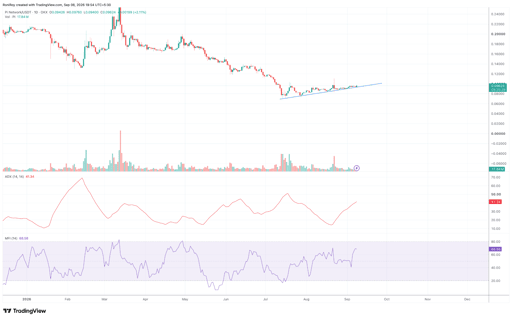
ADX has climbed to 41.34 on the daily timeframe. Readings above 25 usually accompany a well-established trend, and the indicator's rise from below 20 in late August shows that the current price trend has strengthened as PI moved towards $0.10.
The daily Money Flow Index has risen to 68.58, up sharply from its early-September dip.
Buying pressure has therefore increased alongside the price, but the MFI remains below 80, the level commonly associated with overbought conditions.
PI now needs to clear the $0.0971–$0.10 area to extend the pattern of higher lows into a higher high.
A daily close above $0.10 could open a move towards $0.1045, followed by the August spike region around $0.11.
Failure to break $0.10 would leave the ascending trendline and the $0.092–$0.094 zone as the first area to watch.
On the 4-hour chart, PI has climbed from roughly $0.086 in mid-August to $0.0962, with the latest candles consolidating just below $0.097. See below.
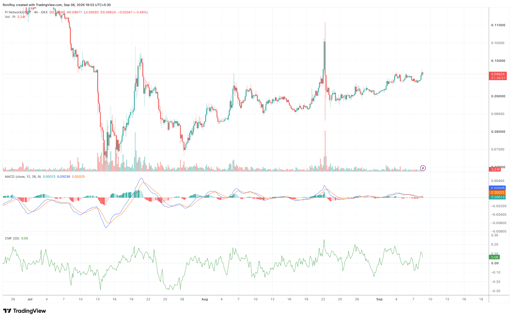
The price has held above $0.09 since late August despite several attempts to move lower.
MACD has started turning higher again. The MACD line stands near 0.00038, above its signal line at roughly 0.00025, while the histogram has returned to positive territory at approximately 0.00013.
The crossover supports another attempt at $0.097 and potentially $0.10 if the positive histogram expands as price moves higher.
Chaikin Money Flow sits at 0.06, recovering above zero after briefly turning negative.
Positive CMF means more volume is occurring during periods when PI closes towards the upper end of its trading range, giving the latest price increase some support from buying pressure.
A break above $0.10 with MACD remaining positive and CMF holding above zero would put $0.104–$0.105 in focus before the previous spike around $0.11.
If PI is rejected below $0.10 and loses $0.094, the next support sits near $0.090, with the daily ascending trendline determining whether the recovery from July remains intact.

Solana tests $100 as whale traders bet on a rebound

Zcash eyes further gains, but overbought RSI warns of pullback

Interview: Bitcoin Japan’s big bet on AI economy, from SpaceX to rare earths

Why is XRP falling even as ETF money keeps flowing into the market?

Why is Ethereum stuck below $2,500 even as ETF inflows stay strong?
No results found
Loading articles...
Failed to load articles. Please try again.