PI eyes $0.19 as mainnet migration halts: Check forecast

PI, the native coin of the Pi Network, is one of the best performers among the top 50 cryptocurrencies by market cap.
The coin has added 4% to its value since Tuesday, outperforming major cryptocurrencies like Bitcoin, Ether, XRP, and BNB.
PI is trading below $0.1900, with its rally supported by a short-term pause in mainnet migration, which reduces pressure on the PI token supply for Centralized Exchanges (CEXs).
Technical indicators suggest that PI could rally higher in the near term, with the bulls already targeting the closest resistance levels.
Halt in Mainnet migration pushes PI’s price higher
PI is currently outperforming the broader cryptocurrency market, adding 4% to its value in the last 24 hours.
The rally comes as Pi scan data revealed that the mainnet migration, which allows users to deposit PI tokens from testnet after completing Know Your Customer (KYC) verification, has been inactive since Friday.
The on-chain data shows that the last daily migration of 259,397 PI tokens was carried out on Friday.
The halt in migration has reduced pressure on the PI token supply for CEXs, supporting the demand spike.
It has also helped push PI’s price higher over the past seven days.
Overall, Pi has reached 16 million Mainnet-migrated Pioneers, distinguishing Pi as a massive identity-verified blockchain.
Earlier this year, Pi released a major technical update that unblocked nearly 2.5 million Pioneers who were previously stuck due to additional compliance and security checks.
Eligible users who have completed the Mainnet Checklist and remain active in mining are now seeing their balances automatically migrated to the blockchain.
The release resulted in heavy selling pressure on PI.
However, with the mainnet migration now on pause, the pressure on the PI token supply from CEXs has eased, supporting the demand spike.
PI is approaching a crucial resistance level
The PI/USD 4-hour chart is among the most bullish for the top 50 cryptocurrencies by market cap.
PI is currently trading at $0.1870, up by 4% in the last 24 hours.
The rally has seen PI surpass the 50-day Exponential Moving Average (EMA) at $0.1773, indicating short-term buy-side bias.
It is now approaching the $0.1919 support-turned resistance level marked by the October 11 low.
If the daily candle closes above this level, PI could extend its rally to the $0.2177 resistance, aligning with the December 19 high.
The Relative Strength Index (RSI) is at 63 on the4-hour chart, showcasing a steady increase from the oversold region last week.
The increased RSI indicates buying pressure from investors.
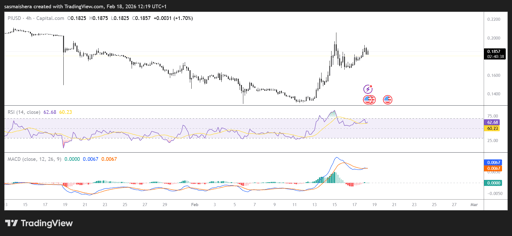
The Moving Average Convergence Divergence (MACD) is also approaching the zero line after a bullish crossover on Friday.
If the bulls fail to overcome the $0.1919 resistance level, PI could retest the support level at $0.1773.
The next support level is $0.1533, aligning with the October 10 low.

Stellar price outlook: Golden cross signals hope as XLM eyes $0.20 breakout

Cardano price prediction ahead of July 18 Van Rossem hard fork

Bitcoin under pressure as US–Iran tensions and ETF outflows weigh on price

Dogecoin nears yearly low: is a brutal drop below $0.069 coming?

BONK crashes 19% as hacker moves $4.1M to Binance: more plunge ahead?
No results found
Loading articles...
Failed to load articles. Please try again.