Ethereum falls below key levels as ETF outflows spark fresh selloff concerns

AI Sentiment: 18/100 Bearish
This score is generated through AI-driven analysis of the article's content.
powered by
Second-order: ETF outflows + DeFi TVL erosion (down >$17B since late March, plus recent hacks) usually push capital out of ETH-linked yield strategies first, then into stablecoin liquidity. Trade: rotate into USDC (or USDC yield on reputable venues) and avoid ETH beta until TVL stabilizes; you benefit if ETH keeps bleeding while you earn carry on cash.
Key Risk: DeFi TVL stops falling and ETH rallies hard, causing stablecoin holders to miss the rebound.
ETF outflows are the dominant driver: ~$61.7M outflow Tuesday after ~$85.6M Monday, signaling institutions are stepping back and tightening liquidity. Price is below the 50/100/200-day EMAs ($2,247/$2,317/$2,557) with bearish momentum (negative MACD, RSI ~42 not oversold). Trade: sell ETH spot or short ETH via a liquid perp; target a break below $2,067 support, then $2,000 psychological.
Key Risk: ETH reclaims $2,247 on a daily close, flipping momentum and forcing shorts/ETF sellers to chase higher.
- Spot Ethereum ETFs recorded outflow of $61 million, extending losing streak.
- Retail participation continues to increase, with rising OI painting a bullish picture.
- ETH could reclaim the $2,318 in the near term if the bulls regain control.
Ethereum ETH is hovering around $2,130, up 1% on Wednesday after facing strong selling pressure over the past week.
The leading altcoin dipped from above $2,300 after retail wallet distributions. The selloff also came following soaring inflation and rising US Treasury yields.
For Ethereum, the coin could face further selling pressure in the near term amid declining institutional demand.
The technical indicators are also bearish at the moment, suggesting further selloff in the near term.
Liquidity pressure intensifies amid ETF outflows
Ether is up 1% in the last 24 hours as the bulls hold the $2,067 support level.
The leading altcoin is down 8% in the last seven days, aligning with the selloff in the broader cryptocurrency market.
The bearish performance comes due to the capital outflows from Ethereum-linked ETFs.
The outflows mean that institutions are reducing their demand for Ethereum ETFs, adding liquidity pressure to the market.
Data obtained from CoinGlass’s Ethereum ETF page reveals that spot Ethereum ETFs recorded an outflow of US$61.7 million (approx. $79.6 million) on Tuesday, after losing US$85.6 million (approx. $110.4 million) the previous day.
In addition to that, the Ethereum Foundation was subject to heightened community scrutiny over transparency and governance stemming from various high-profile leadership departures,
Ethereum’s on-chain data showed significant erosion in DeFi capital, with total value locked in Ethereum protocols falling by over US$17 billion (approx. $21.9 billion) since late March.
The recent hacks of various DeFi protocols, including Kelp DAO and Drift Protocol, affected Ethereum’s TVL over the past few days.
While institutional demand is declining, retail traders are increasing their exposure in the market. The derivatives data show improved retail demand.
According to CoinGlass, Ethereum’s futures Open Interest now stands at US$32.2 billion (approx. $41.5 billion), up from the US$30.8 billion (approx. $39.7 billion) recorded on Tuesday.
The OI-Weighted Funding Rate also reads 0.0076%. The funding rate has been positive since April 30, indicating growing retail participation.
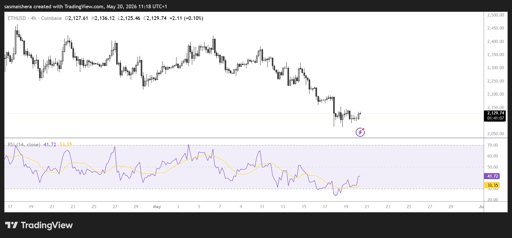
ETH finds support around key $2,067 zone
The ETH/USD 4-hour chart is bearish and efficient as Ethereum is down 8% in the last seven days.
At press time, ETH is trading at $2,130, below the 50-day, 100-day, and 200-day EMAs clustered above $2,247, $2,317, and $2,557, respectively.
The momentum indicators suggest that the bears are still in control.
The 4-hour RSI at 42 means that the bears are in control, but Ethereum is not yet in the oversold territory.
Meanwhile, the negative MACD reading hints that downside momentum persists despite already-depressed oscillators.
If the bulls regain control, they would encounter immediate resistance at the $2,247 level, which coincides with the 50-day EMA.
A daily candle close above this level would allow ETH to reclaim the $2,318 resistance zone in the near term.
The resistance levels at $2,557 and $2,771 continue to limit recovery attempts.
However, if the selloff continues, immediate support emerges at the $2,067 level, where a break would expose further weakness in the near term.

Pi Network price forecast: Will Protocol v25 boost overcome token unlock pressure?

DEXE price crashes 80% in 24 hours as alleged team sell-off sparks panic

Movement (MOVE) files for Chapter 11 as $141.4M in funding fails to prevent collapse

XRP stalls below key EMAs: is this recovery weaker than it looks?

Cardano hits a wall near $0.178 as leveraged demand starts to fade
No results found
Loading articles...
Failed to load articles. Please try again.