Solana rebounds above $65, but bearish signals still dominate

AI Sentiment: 28/100 Bearish
This score is generated through AI-driven analysis of the article's content.
powered by
Buy Bitcoin (BTC-USD) as the relative-strength trade. The article says BTC is above $63,000 after the dump, while SOL is still structurally weak with institutional outflows. If crypto is in a “risk-off but stabilizing” phase, capital tends to rotate to the strongest, most liquid asset first. Thesis: BTC holds up better and grinds higher while SOL lags.
Key Risk: A renewed market-wide selloff that drags BTC below the post-dump support level (around the low-$60k area), breaking the stabilization thesis.
Short Solana (SOL-USD) into weakness. The relief bounce is running into a wall: SOL is still far below the 50/100/200-day EMAs ($81.5/$87.9/$104) and ETF products just flipped to net outflows (~$6.52M). Derivatives confirm caution: funding is negative (around -0.0165%), which often lines up with extended corrections after bounces. Thesis: rallies fade until SOL reclaims the 50-day EMA.
Key Risk: SOL breaks and holds above ~$81.5 (50-day EMA), flipping trend and forcing shorts to cover.
- Solana slightly dropped below $60 over weekend amid broader selloff.
- Weak ETF flows and bearish derivatives keep SOL under pressure.
- SOL could decline towards $50 if the bearish trend persists in near term.
Bitcoin and the broader cryptocurrency market are having a relief rally following last week’s massive dump.
Bitcoin has slightly recovered and is now trading above $63,000. Meanwhile, Solana’s SOL has climbed above $65 after shedding nearly 20% over the past week.
However, Solana continues to trade under pressure amid weakening institutional inflows, deteriorating derivatives positioning, and persistent technical weakness across key indicators.
Spot ETF outflows break four-week inflow streak
SOL underperformed last week thanks to declining institutional demand. Spot Solana ETF products recorded a net outflow of approximately $6.52 million last week.
This marks a sharp reversal from a four-week streak of positive inflows that began in early May, signaling a potential shift in institutional positioning.
Analysts warn that if outflows continue or accelerate, Solana could face additional downside pressure in the near term.
In addition to that, futures and derivatives markets are also signaling weakening confidence.
According to CoinGlass, Solana’s funding rate has turned negative and deepened to its lowest level since February, currently sitting around -0.0165%.
This indicates that short positions are paying longs, a setup that often reflects bearish sentiment in perpetual futures markets.
Historically, sustained negative funding rates have coincided with extended corrective phases following brief relief rallies.
However, Solana’s long-to-short ratio has climbed to 1.0129, suggesting that the bulls could be regaining control of the market.
The mixed derivatives data suggest that there is indecision among Solana traders after the coin bounced back from the Saturday low of $59.
Solana price forecast: Technical outlook remains fragile
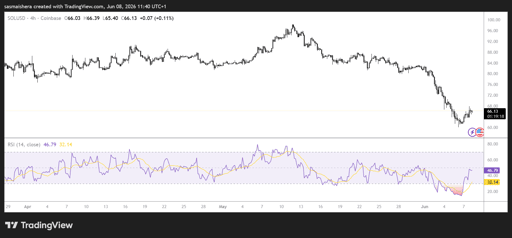
Similar to the other leading cryptocurrencies, the SOL/USD 4-hour chart is extremely bearish following last week’s massive decline.
At press time, Solana is trading at $66, below the 50-day EMA at $81.50, 100-day EMA at $87.90, and the 200-day EMA at $104.00. This suggests that the bearish trend remains in place.
Momentum signals also remain weak. However, they are showing signs of recovery on the 4-hour timeframe.
The MACD continues to trend in negative territory, while the Relative Strength Index (RSI) sits near 47, indicating that Solana is now approaching the neutral zone.
The oversold conditions last week were followed by short-term rebounds, which could point to reversal signals on the lower timeframes.
If the bearish trend persists this week, the sellers would encounter immediate support at $60, a critical psychological and structural level.
A break below this zone could open the door toward $50, deepening the broader downtrend.
However, if the recovery continues, the bulls could face the first major resistance around the 50-day EMA at $81.50.
A daily candle close above this level could pave the way for Solana to retest higher resistance zones at $87.90 and $104.
The current market conditions suggest a relief bounce. However, the broader market structure remains weak.
Continued ETF outflows and negative derivatives positioning indicate that sellers still maintain control unless Solana can reclaim key resistance levels in the coming sessions.

Stellar price outlook: Golden cross signals hope as XLM eyes $0.20 breakout

Cardano price prediction ahead of July 18 Van Rossem hard fork

Bitcoin under pressure as US–Iran tensions and ETF outflows weigh on price

Dogecoin nears yearly low: is a brutal drop below $0.069 coming?

BONK crashes 19% as hacker moves $4.1M to Binance: more plunge ahead?
No results found
Loading articles...
Failed to load articles. Please try again.