Gold price loses crucial support ahead of US CPI data: will it crash to $4,000?

AI Sentiment: 12/100 Bearish
This score is generated through AI-driven analysis of the article's content.
powered by
Sell XAU/USD now that it broke below $4,300 and printed a death-cross (50/200 EMA). The setup is bearish into US CPI/PPI because hotter inflation keeps the Fed on the path to higher rates, which typically crushes gold. Target $4,092, then reassess if it loses that level.
Key Risk: CPI/PPI comes in much cooler than expected, pushing rate-cut odds up and triggering a sharp gold squeeze back above $4,300.
Sell VanEck Gold Miners ETF (GDX) as a higher-beta way to express the gold breakdown. Miners usually fall faster than bullion when gold trends down and real-rate expectations rise. Use the same catalyst window (CPI/PPI) and aim for accelerated downside versus gold if $4,092 breaks.
Key Risk: Gold stabilizes and rebounds on a CPI/PPI miss, causing miners to snap back harder than bullion and erase the relative downside.
- Gold price dropped below the key support level at $4,300.
- The retreat happened amid US and Iran escalation.
- The US will publish the latest consumer price index data.
Gold price made a strong bearish breakout overnight, reaching its lowest level since March 23rd this year. It dropped to a low of $4,180, down by over 25% from its highest point this year. This retreat may continue now that it has formed a death cross pattern ahead of the US inflation report.
Gold price slips as US-Iran conflict escalates
There are signs that the US-Iran conflict is escalating. According to the United States, Iran attacked a US Apache helicopter that was patrolling the Strait of Hormuz. While the US personnel were not injured, Trump said that the military had to respond to these attacks.
The US military reacted by launching several attacks against key Iranian targets, including their land surveillance systems. Iran, on the other hand, launched attacks against key US installations in Bahrain.
Israel then launched more attacks in Lebanon, a move meant to enrage Iran and push the US to end the ceasefire. Analysts believe that Israel wants the war to resume fully, a move that will weaken Iran further. Trump, on the other hand, wants to get out in hopes that it will help to improve his approval rating.
Gold has become highly sensitive to the ongoing developments in the Middle East. It often drops whenever the situation escalates because it normally leads to higher energy prices, which pushes inflation higher over time.
READ MORE: Citi trims 3-month gold target to $4,000 on softer demand
US consumer inflation report ahead
Gold price retrated as the US prepared to publish the latest consumer inflation report. Economists polled by Reuters and a Polymarket poll shows that analysts expect the data to show that the headline Consumer Price Index (CPI) jumped to 4.2% in May. If this is correct, it will be the highest inflation rate since the Joe Biden era.
Another report coming out on Thursdsay is expected to show that the Producer Price Index (PPI) jumped to 6.4% in May from 6.0% in the previous month. These numbers are moving further away from the Federal Reserve’s 2% target.
The data come a few days after the US published a strong non-farm payrolls (NFP) report. This report showed that the labor market is strong, with the economy adding over 172k jobs during the month. The private sector added 122k jobs in May, according to ADP.
As such, these numbers are signaling that the Federal Reserve will hike interest rates later this year. Gold price normally underperforms the market whenever the Fed is hiking interest rates.
XAU price technical analysis
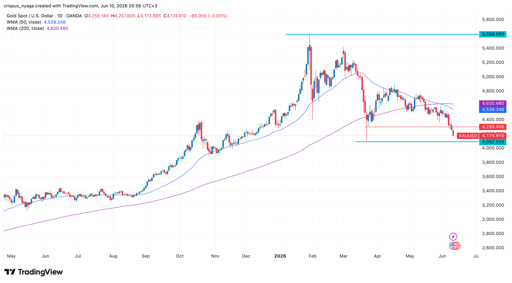
Gold price chart | Source: TradingView
The daily chart shows that gold has plunged from a high of $5,598 in January to a low of $4,178 today. It crashed below the important support level of $4,300, its lowest level on March 24.
A closer look shows that gold has formed a death cross pattern as the 50-day and 200-day Exponential Moving Averages (EMA) crossed each other. This pattern normally leads to more downside.
Therefore, there is a risk that it will fall further to a low of $4,092, its lowest point on March 23rd. A move below that level will point to further downside as the markup phase of the Elliot Wave pattern escalates.

SCHD just hit a crucial milestone: is it a good dividend ETF to buy?

From dilution to cash flow: Is BitMine stock worth buying now?

Celestica stock tumbles ahead of earnings: rebound or more pain?

BlackBerry stock has plunged 35% from the YTD high: buy the dip?

Aston Martin stock: buy or sell this FTSE 250 name as risks mount?
No results found
Loading articles...
Failed to load articles. Please try again.