Can Bitcoin break $70,000 after muted reaction to Iran ceasefire?

AI Sentiment: 62/100 Bullish
This score is generated through AI-driven analysis of the article's content.
powered by
Buy BTC/USD (spot or BTC perpetuals) for a push through $68,003 toward $70,000. The chart is still bullish (MACD positive; RSI only cooled to 64), and the macro tape is risk-on after the Iran ceasefire progress. Bitcoin’s muted move looks like “not fully priced yet,” not a trend break—so upside should re-rate once traders stop waiting for durability.
Key Risk: The Iran memo is revoked or tensions flare again before June 19, flipping risk back off and breaking the $63,707 support.
Sell US spot Bitcoin ETF exposure (e.g., short BITO/IBIT/FBTC exposure via the most liquid ETF you can trade) because the news hasn’t brought institutional inflows back—four straight weeks of outflows (~$5.4B). If institutions stay sellers, BTC can rally on retail/macro, but ETF-linked demand will cap follow-through and create sharp pullbacks on any disappointment.
Key Risk: ETF outflows reverse quickly (new inflow streak) and institutions re-accelerate buying, letting BTC run through $70,000 without retracing.
- Bitcoin is up 1% over 24 hours and 5.8% on the week, trading above $66,000.
- Analysts say the rally is a relief move that the market hasn't fully bought yet.
- Bitcoin could reclaim the $70,000 level if the market recovery persists.
Bitcoin briefly climbed above $67,000 late Monday before slipping back under $66,800, highlighting the market’s cautious response to improving geopolitical headlines that have boosted other risk assets.
The world’s largest cryptocurrency is trading at $66,720 on Tuesday, up 1% over 24 hours and 5.8% on the week.
It reached an intraday high of $67,217 before losing momentum.
Macro markets rally on Iran ceasefire progress
Broader markets reacted more decisively to developments in the Iran conflict.
President Donald Trump and Vice President JD Vance signed an electronic memorandum of understanding with Iran, with Trump stating that the Strait of Hormuz—already partially reopened—would fully reopen by Friday.
The news triggered a sharp decline in oil prices, with Brent crude falling below $83 per barrel after its steepest drop in more than two weeks.
Equities also rallied, with the S&P 500 gaining 1.7% and the Nasdaq 100 climbing 3.1%.
Despite this risk-on backdrop, Bitcoin’s reaction remained muted compared to traditional markets.
Market participants say Bitcoin’s hesitation reflects uncertainty over whether the geopolitical improvement will hold.
Jimmy Xue, co-founder and COO of Axis, noted that the rally is a relief move that the market hasn't fully bought yet, rather than a clear risk-on redeployment into Bitcoin
The analysts added that this is the third attempted truce in the region, with previous ceasefire rallies in April and June ultimately reversing when tensions resumed.
Trump also suggested the deal could be revoked if Iran fails to agree to shut down its nuclear program.
Traders are now reportedly waiting for a scheduled June 19 signing in Switzerland before treating the agreement as durable.
Part of Bitcoin’s restrained reaction may also reflect recent institutional flows.
US spot Bitcoin ETFs have recorded four consecutive weeks of outflows totaling roughly US$5.4 billion (approx. $7 billion), including a single record week of about US$3.4 billion (approx. $4.4 billion).
In addition to this, Bitcoin ETFs recorded an outflow of $64.80 million on Monday, suggesting that institutions are yet to resume their Bitcoin accumulation.
The absence of consistent institutional demand continues to limit upside momentum for the leading cryptocurrency.
Will Bitcoin reclaim the $70,000 level soon?
The BTC/USD 4-hour chart remains bullish and efficient as the broader cryptocurrency market maintains the uptrend.
At press time, Bitcoin is trading above the $66,000 level. The momentum indicators suggest that the bulls are still in control.
Despite the Relative Strength Index (RSI) dropping to 64 from 71 on Monday, the indicator maintains a bullish bias.
The MACD lines are also within the positive territory, adding further confluence to the bullish bias.
If the rally resumes, Bitcoin could surge past Monday’s high of $67,300 and hit the first major resistance level at $68,003.
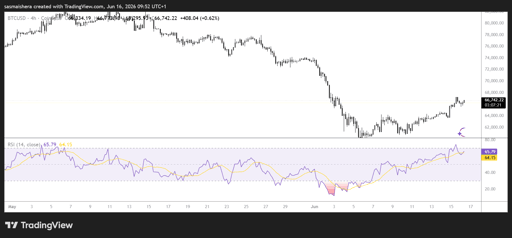
A daily candle close above this level could allow BTC to hit the $70,000 level for the first time in two weeks.
However, if the market correction persists, Bitcoin could retest the first major support level at $63,707.
This support level is also a 4-hour Transactional Liquidity (TLQ) zone, indicating a possible reversal point.

Will AAVE hold above $100 as buyers target resistance at $103?

Is PUMP price headed for more gains after its 10% rally?

Injective price forecast: Coinbase integration strengthens bullish case for INJ

Bitcoin price outlook: treasury sell-offs, Poolin bankruptcy and $1.2B options expiry

How high can BEAT go as whale withdrawals drain exchange supply?
No results found
Loading articles...
Failed to load articles. Please try again.