Ethereum clears key breakout level as RSI rebounds from oversold territory

AI Sentiment: 68/100 Bullish
This score is generated through AI-driven analysis of the article's content.
powered by
ETH broke and reclaimed $1,720 and is rebounding from ~$1,500 with RSI recovering from oversold. Corporate treasury buying (Bitmine acquiring 76,881 ETH) plus whale accumulation is removing supply and supporting dips. Add on strength toward $1,850 (measured target) and hold for a push back above the 20-day EMA (~$1,793) as momentum improves.
Key Risk: ETH fails to hold $1,720 and rolls back below ~$1,700, turning the breakout into a bull trap.
Use options to target the next resistance step: a retest/hold of $1,850 and a move toward $2,000 while limiting premium risk. The article flags $1,850 as the pattern objective and notes longer-term resistance overhead (50-day/200-day EMAs). A call spread captures upside if the recovery continues without paying for a full bet on a $2,385 move.
Key Risk: Macro/crypto risk-off returns and ETH drops back under the $1,720 support level, making the calls expire worthless.
- Institutional buying is powering Ethereum's recent recovery.
- ETH price has broken out of an ascending triangle pattern.
- RSI has rebounded from oversold levels.
Ethereum has climbed more than 4% over the past week, recovering from a recent slide as corporate treasury buying, whale accumulation, and improving geopolitical sentiment have combined to lift demand for the second-largest cryptocurrency.
According to Bitmine Immersion Technologies, the company recently completed a US$273.8 million (approx. $353.2 million) preferred equity raise and used US$136 million (approx. $175.5 million) of the proceeds to acquire 76,881 ETH in a concentrated buying period.
The purchase forms part of a treasury strategy modeled on the approach popularised by Strategy's Bitcoin accumulation playbook.
Bitmine said its Ethereum holdings have now reached roughly 5.62 million ETH, giving the company control of about 4.66% of the asset's circulating supply.
Such large purchases have removed a notable amount of supply from the market, helping support a rapid rebound after Ethereum fell to its lowest level since April 2025.
At the same time, on-chain data tracked by blockchain analysts showed a wallet linked to BitMEX co-founder and Maelstrom CIO Arthur Hayes acquired 3,000 ETH worth about US$5.4 million (approx. $7 million) through FlowDesk.
The purchase came as Ethereum was recovering from its recent lows, adding to signs that large investors were willing to accumulate during weakness.
Market sentiment also received support from geopolitical developments.
Reports of a US-Iran peace agreement and ceasefire reduced concerns over further conflict in the Middle East and eased fears surrounding disruptions to shipping through the Strait of Hormuz.
As risk appetite returned across financial markets, capital flowed back into higher-risk assets, including cryptocurrencies.
Only days earlier, Ethereum had been under pressure from a combination of macroeconomic and institutional factors.
Spot Ethereum exchange-traded funds recorded substantial outflows as investors pulled capital from crypto investment products amid persistent inflation concerns and rising bond yields.
Higher yields increased the appeal of traditional fixed-income assets, encouraging some institutional investors to reduce exposure to more volatile assets.
During that period, Ethereum fell nearly 20%, dropping toward the $1,500 level before finding support.
Ethereum price analysis
Recent price action suggests buyers have regained control in the short term, although the longer-term trend remains under pressure.
Crypto analyst Ali Martinez recently highlighted an ascending triangle pattern on Ethereum's four-hour chart.
If Ethereum $ETH revisits $1,070, I believe it would present one of the best buying opportunities on the chart, according to this multi-year channel pattern. https://t.co/LNkygeXO5n pic.twitter.com/ZLHNjiUPJl
— Ali Charts (@alicharts) June 14, 2026
The setup identified resistance near $1,720 and projected a breakout target around $1,850 if the price moved above that level.
Market data shows Ethereum has already broken above the $1,720 resistance area and briefly traded near the projected target zone around $1,840 to $1,850 before retreating.
With the pattern's measured objective largely achieved, traders are now watching whether the former resistance zone can hold as support.
On the daily chart, Ethereum is trading near $1,760 after rebounding from lows around $1,500. The recovery has pushed the Relative Strength Index, or RSI, out of deeply oversold territory.
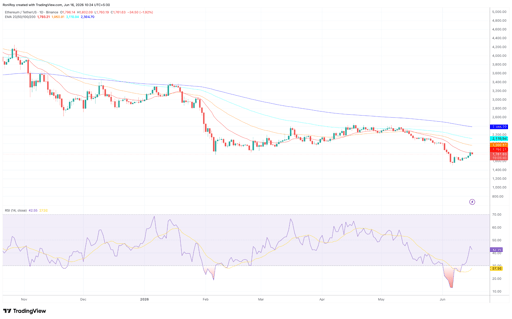
ETH/USDT 1-Day price chart. Source: TradingView.
Current chart data places the RSI near 42.5, up from levels below 20 reached during the selloff.
The indicator has also crossed above its moving average, a development that traders often associate with improving momentum.
However, the RSI remains below the 50 level, suggesting bullish momentum has not yet fully returned.
Moving averages continue to present a more cautious picture.
Ethereum remains below its 20-day exponential moving average near $1,793, while the 50-day, 100-day, and 200-day exponential moving averages sit near $1,961, $2,117, and $2,385.
Because price remains below all major trend indicators, the longer-term structure has not yet turned bullish.
A sustained move above the 20-day EMA would be an early sign of strength, while a break above the 50-day EMA could indicate that the recovery is gaining traction.
Further overhead, the 200-day EMA around $2,385 represents a major resistance zone.
A move toward that level would place Ethereum near a major long-term resistance area that could determine whether the current recovery has staying power.
Simultaneously, crypto analyst Poseidon has argued that Ethereum may be in the final stages of a multi-month accumulation phase, suggesting prices below $2,000 could become increasingly difficult to find over the coming years if a larger uptrend develops.
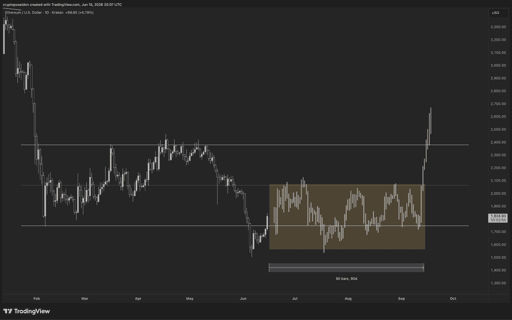
ETH/USD 1-Day price chart. Source: Poseidon on X.
Beyond price action, Ethereum's underlying network activity has remained strong.
Data from tokenization trackers shows real-world assets on Ethereum have exceeded US$16.6 billion (approx. $21.4 billion), representing a 315% increase compared with levels recorded earlier in 2025.
Investors are also monitoring the upcoming Glamsterdam hard fork scheduled for the third quarter.
Combined with corporate treasury demand and renewed market optimism, those developments have helped support Ethereum's recovery after one of its sharpest declines of the year.

CSPR price climbs 5%: can Casper extend its recovery?

Europe's 2026 digital identity deadline opens a $47 billion market

Will SHIB price crash as whales sell?

Why is Bitcoin crashing today after briefly reclaiming $65,000?

Can Shiba Inu coin price extend its rally as 1T tokens leave exchanges?
No results found
Loading articles...
Failed to load articles. Please try again.