SOL slips below $70 as price weakness persists amid rising institutional interest

AI Sentiment: 35/100 Bearish
This score is generated through AI-driven analysis of the article's content.
powered by
Buy Solana (SOL) for a reversal attempt: price is weak, but ETF inflows ($7.11m weekly) and MSOL S-1 progress point to real institutional bid. The 4-hour MACD bearish momentum is fading and a descending wedge is forming—so the setup is for a squeeze if SOL reclaims $75.63. Key trigger: add on a reclaim/hold above $75.63; target a move toward $83.50; exit if it loses $60.13.
Key Risk: SOL breaks down through $59.16 and the wedge fails, overwhelming ETF demand with a broader crypto risk-off move.
Sell Solana futures/perps to monetize the still-bearish structure: long liquidations ($15.02m) vs short ($1.52m) shows the market is positioned for downside. Until SOL reclaims $75.63, rallies are likely to be sold. Trade: short SOL perps on strength into $75–$76, cover into $68 and again near $60.13; stop if SOL holds above $75.63.
Key Risk: A clean weekly reclaim above the overhead trendline (~$83.50) triggers a squeeze that forces shorts to cover.
- SOL-focused Exchange-Traded Funds (ETFs) recorded $2.99 million in inflows on Thursday.
- Solana OI has declined to $4.79 billion, down from $5.18 billion earlier in the week.
- SOL could retest the $59.16 monthly low if the bearish trend persists.
Solana has dropped below $70 on Friday, extending its losing streak to four consecutive days.
Despite continued price weakness, underlying market signals show a divergence between growing institutional engagement and mixed retail sentiment, creating a complex outlook for the token.
Institutional demand builds through ETF inflows and new filings
Institutional interest in Solana continues to strengthen even as price action weakens.
Data shows SOL-focused Exchange-Traded Funds (ETFs) recorded $2.99 million in inflows on Thursday, bringing weekly inflows to $7.11 million.
While monthly flows remain slightly negative at around $2.00 million, sustained inflows could push the category back into positive territory and extend a streak of eight consecutive months of net inflows.
Adding to this momentum, Morgan Stanley submitted an amended S-1 filing to the US Securities and Exchange Commission for its Solana-focused ETF (MSOL), signaling continued institutional product development around the asset.
🚨JUST IN: Morgan Stanley has submitted an amended S-1 for $MSOL, its proposed spot @Solana ETF. pic.twitter.com/Also6gVXHW
— SolanaFloor (@SolanaFloor) June 18, 2026
These developments suggest that large-scale investors are gradually increasing exposure to Solana, even as broader market sentiment remains cautious.
Retail participation in Solana markets appears more fragmented. CoinGlass data shows Solana futures Open Interest has declined to $4.79 billion, down from $5.18 billion earlier in the week.
The decline in open contracts indicates waning speculative activity and lower short-term trading engagement.
Liquidation data further highlights bearish pressure. Over the past 24 hours, long liquidations totaled approximately $15.02 million, significantly exceeding $1.52 million in short liquidations.
This imbalance reflects a market still tilted toward downside positioning.
However, on-chain activity presents a contrasting picture. Solana continues to see strong ecosystem engagement, particularly in tokenized Real-World Assets (RWAs).
According to SolanaFloor, the network now hosts over 285,000 RWA holders following the tokenized SpaceX IPO activity, making it one of the leading chains in this category.
BREAKING: Following the $SPCX tokenized IPO, @Solana has become the #1 chain for real-world assets by holder count, surpassing 285K holders. pic.twitter.com/pqVh2iKCmM
— SolanaFloor (@SolanaFloor) June 19, 2026
Solana price outlook: Bearish structure dominates, but wedge pattern offers hope
Similar to the other leading cryptocurrencies, the SOL/USD 4-hour chart remains extremely bearish.
Despite pockets of strength in fundamentals, Solana remains in a broader downtrend after reversing from its September peak near $253.
On the weekly chart, price action is forming a descending wedge pattern, which typically signals potential bullish reversal conditions if a breakout occurs.
However, downside risk remains prominent in the near term.
At press time, SOL is trading at $68. The next major support zone lies near the Fair Value Gap (FVG) between $46.90 and $51.12, formed in November 2023.
Before reaching that level, the bulls would likely defend the support levels near $60.13 and the June 6 low of $59.16.
For bullish momentum to re-emerge, buyers must first reclaim $75.63. A stronger confirmation would require a weekly close above the overhead resistance trendline near $83.50, which could validate a broader trend reversal from the current bearish structure.
Momentum indicators remain cautious. The 4-hour Moving Average Convergence Divergence (MACD) shows weakening bearish momentum as histograms contract near the signal line.
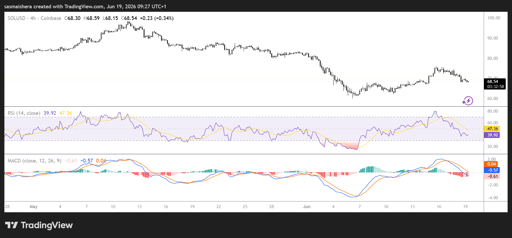
Meanwhile, the Relative Strength Index (RSI) sits around 47, reflecting subdued momentum without a clear reversal signal.
Until key resistance levels are reclaimed, Solana remains vulnerable to further bearish movement despite improving institutional participation.

Dollar weakens as US stock futures gain on improved risk sentiment

AAVE price forecast: bulls eye $125 as bull flag breakout nears

ServiceNow stock plunges ahead of earnings: how AI will affect the company

UK stocks steady as rising oil prices lift energy shares amid Middle East tensions

Top 2 reasons why Watches of Switzerland share price is soaring
No results found
Loading articles...
Failed to load articles. Please try again.