Cardano slides 11% but whales load up 370M ADA in dip-buying spree

AI Sentiment: 38/100 Bearish
This score is generated through AI-driven analysis of the article's content.
powered by
Use the mixed derivatives picture: longs are only slightly favored (funding ~+0.005%), while the broader market remains bearish. Buy short-dated ADA puts to profit if the $0.148 support fails—this is the structural floor the article flags. This captures downside continuation even if whales keep accumulating.
Key Risk: ADA holds $0.148 and rebounds through $0.181/$0.204, crushing put value.
ADA is still below the 50/100/200-day EMAs ($0.204/$0.236/$0.311) with a bearish 4-hour structure. Whale buying is real, but derivatives still lean cautious (long/short ~0.65, near lows), so rallies likely fade into resistance ($0.181 then $0.202–$0.204). Sell ADA now and re-enter only after a clean reclaim of the 50-day EMA.
Key Risk: ADA breaks above $0.204 and holds, turning the dip-buying into a real trend reversal.
- Large holders increased their ADA exposure during recent market sell-off.
- Cardano's derivatives data suggests that a bearish trend could persist.
- ADA could retest $0.148 key support level if bears remain in control.
Cardano ADA is trading at $0.160 on Monday, following a sharp 11% decline over the past week.
While on-chain data suggests some large holders are accumulating during the dip, derivatives market indicators continue to signal caution, limiting expectations for a near-term recovery.
The divergence between spot accumulation and derivatives sentiment highlights growing uncertainty around ADA’s short-term direction.
Whale wallets accumulate during price weakness
On-chain data from Santiment shows that select large holders increased their ADA exposure during the recent sell-off.
Wallets holding between 10 million and 100 million ADA accumulated approximately 370 million tokens since June 15, signaling sustained interest from the largest cohort of investors.
In contrast, wallets holding between 100,000 and 1 million ADA, along with those in the 1 million to 10 million range, reduced their holdings by a combined 10 million tokens over the same period.
This split suggests a divergence in behavior among whale cohorts: while mid-sized large holders appear to have reduced exposure during the downturn, the largest holders took advantage of lower prices to accumulate.
Although this “buy-the-dip” activity may support longer-term sentiment, it has not been strong enough to reverse ADA’s immediate downtrend.
Signals from the derivatives market remain inconsistent, pointing to indecision among traders.
Cardano’s long-to-short ratio, tracked by CoinGlass, stands at 0.65—approaching its lowest level in over a month.
A reading below 1 typically indicates bearish sentiment, with more traders positioning for further downside.
However, funding rate data present a more balanced picture. ADA’s open interest-weighted funding rate has turned slightly positive at 0.0050%, suggesting that long positions are beginning to pay shorts, a signal often associated with mild bullish bias.
Together, these indicators reflect a divided market, with neither bulls nor bears firmly in control.
Cardano technical outlook: Downtrend remains intact
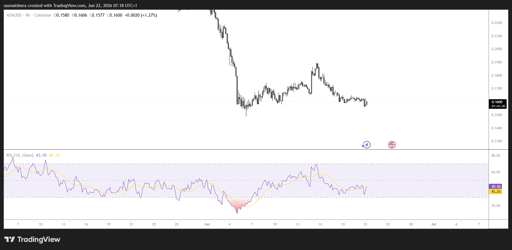
The ADA/USD 4-hour chart remains bearish as Cardano is down by roughly 1% in the last 24 hours.
From a technical perspective, Cardano continues to trade under pressure, remaining below key moving averages that confirm a broader bearish structure.
Currently, ADA is trading at $0.1602, below the 50-day EMA ($0.204), 100-day EMA ($0.236), and 200-day EMA ($0.311), reinforcing the prevailing downtrend.
Momentum indicators show early signs of stabilization but not reversal. The Relative Strength Index (RSI) sits near 41, indicating weak bearish momentum without reaching deeply oversold conditions.
Meanwhile, the MACD shows mild improvement, suggesting that downside pressure may be easing rather than accelerating.
If the market recovers from the dip, ADA faces immediate resistance near the $0.181 mark.
A stronger barrier forms between $0.202 and $0.204, where the 50-day EMA forms. Further resistance is stacked in the $0.230–$0.240 range, where multiple technical levels overlap.
However, if the bearish trend persists, the key support level sits near $0.148, which serves as the primary structural floor.
A breakdown below this zone could open the door to further declines if selling pressure accelerates.
For now, ADA remains caught between whale accumulation signals and a still-dominant bearish market structure, leaving its near-term direction uncertain.

Why is Derive (DRV) price going up? Upbit and Bithumb listings fuel 52% rally

Injective price jumps 5%: can the Washington summit send INJ to $6?

CASHCAT explodes 2,300% as whale buying fuels fresh meme coin frenzy

Shiba Inu price slips again: is SHIB heading back to its yearly low?

Can LAB price recover after crashing 97%?
No results found
Loading articles...
Failed to load articles. Please try again.