HYPE price tests key $62 support as traders weigh rebound after 15% drop

AI Sentiment: 68/100 Bullish
This score is generated through AI-driven analysis of the article's content.
powered by
Buy HYPE if it holds $62 (200-EMA ~62.18 + 0.382 fib ~62.14) and reclaims the 4H EMAs after the death-cross weakness. Target $67–68 first, then $70–72 if momentum returns and volume picks up. Thesis: repeated “launchpad” behavior at $62 plus RSI ~34 (not yet oversold) suggests a consolidation-to-rebound setup rather than a trend break.
Key Risk: HYPE breaks and closes below the $62 support cluster, especially losing the 200-EMA, triggering a fast move toward $57.56.
Sell/short HYPE on a decisive 4H breakdown below $62 with follow-through (not a quick wick). Target $57.56, then reassess for a move toward the 3D 50-EMA near $47 if selling accelerates. Thesis: the death-cross plus failure of the key confluence level turns a “temporary dip” into a trend continuation down.
Key Risk: Buyers defend $62 and HYPE quickly reclaims ~$62.2–$63, squeezing shorts back toward $67–68.
- Hyperliquid bulls are defending $62 support as coin lost 15% in seven days.
- Momentum indicators suggest consolidation could be on the way for Hyperliquid.
- HYPE could drop to $57 support level if traders fail to defend $62 zone.
Hyperliquid’s native token, HYPE, is testing a major technical support area that has repeatedly acted as a launchpad for short-term recoveries in recent weeks.
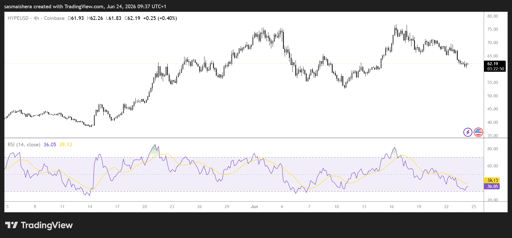
After retreating from its mid-June high near $77, HYPE has fallen back toward the $62 level, placing the token within a key support cluster on the four-hour chart.
Traders are closely watching this area for signs that the latest correction may be nearing exhaustion.
Support confluence strengthens the bullish case
The current support zone around $62 combines several important technical indicators, creating a strong area of price confluence.
These include the 200-period Exponential Moving Average (EMA) near $62.18, the 0.382 Fibonacci retracements level around $62.14, and the lower boundary of the prevailing descending channel.
The convergence of these indicators makes the $62 region a crucial battleground between buyers and sellers.
As long as HYPE remains above this support cluster, the possibility of a short-term recovery remains intact.
One of the key bearish signals currently influencing price action is the recent crossover between the 20-period and 50-period EMAs on the four-hour timeframe.
This "death cross" indicates weakening short-term momentum and has historically preceded temporary declines in HYPE's price.
However, previous occurrences of this signal have not resulted in prolonged downtrends. Instead, they have often led to brief selloffs followed by strong rebounds once oversold conditions emerged.
Momentum indicators suggest a consolidation
The HYPE/USD 4-hour chart is also bearish following the 15% decline over the past seven days.
Momentum indicators suggest that a consolidation could be on the way for Hyperliquid before it resumes its upward trajectory.
The Relative Strength Index (RSI) is currently hovering around 34, indicating weakness but not yet reaching oversold territory.
In prior corrections, HYPE's RSI fell below 30 before meaningful rebounds developed.
This suggests the token may require additional consolidation near the $62 support area before buyers regain enough momentum to push prices higher.
If support around $62 holds, HYPE could stage a recovery toward a significant resistance zone between $67 and $68.
A move into this range would represent the first major recovery target for bulls attempting to regain control of the trend.
If a decisive break happens at this level, it could pave the way for a rally toward the $70 to $72 range, potentially signaling the end of the current pullback and a resumption of the broader uptrend.
However, traders will likely require confirmation through increased buying volume and sustained momentum before adopting a more aggressive bullish outlook.
While the short-term setup remains constructive, losing the $62 support zone would invalidate the current rebound thesis.
A decisive break below the 200-period EMA could expose HYPE to the next major downside target near $57.56.
Such a move would likely accelerate selling pressure and shift attention to higher-timeframe support levels.
If sellers manage to push HYPE below the $57 support region, the outlook could deteriorate significantly.
In that scenario, attention would shift toward the 50-period EMA on the three-day chart near $47, which represents the next major support level.
However, a successful defense of this support would preserve HYPE’s broader bullish market structure and potentially create the foundation for the next upward leg.

Can LINK price reclaim $8 as Chainlink targets real-time FX settlement?

Bitcoin bulls face $64,000 test as ETF outflows weaken sentiment

Dogecoin tests make-or-break support as DOGE selloff deepens

Will Solana price break below $69 as bearish bets pile up?

Is the DEXE rally over?
No results found
Loading articles...
Failed to load articles. Please try again.