SCHD ETF: Why this 'anti-AI' fund is beating the S&P 500 and Nasdaq 100 indices

AI Sentiment: 78/100 Bullish
This score is generated through AI-driven analysis of the article's content.
powered by
Buy SCHD. The fund is “anti-AI” by design (staples, healthcare, energy, industrials) and is acting like a hedge as AI cools. Flows are strong (+$12B net inflows) and the chart is constructive: holding above the 50/100-day averages, ascending channel, and a cup-and-handle setup. Target a push through the YTD high (~$32.92) toward ~$35.
Key Risk: AI leadership re-accelerates and value/defensive dividend stocks lag hard, breaking the technical pattern.
Buy UNH. It’s SCHD’s largest holding (~4.5%) and has already proven the “phoenix” thesis: +80% from last year’s low after turmoil, with earnings beating cost fears. If SCHD keeps attracting flows, UNH should keep benefiting as the market’s top healthcare “quality value” name.
Key Risk: Another earnings/cost-control shock forces UNH to unwind the recovery and drags the whole healthcare sleeve.
- SCHD ETF is beating the Nasdaq 100 and S&P 500 Index this year.
- Its inflows have jumped by over $12 billion this year.
- Technical analysis suggests that the fund has more upside in the near term.
The Schwab US Dividend Equity ETF (SCHD) has performed well this year despite trading within a tight range over the past few weeks. Its total return has risen 19% year-to-date, outperforming Invesco's QQQ, which has returned 15.2%, as well as JPMorgan's JEPI at 7.0% and Vanguard's VOO at 7.53%.
SCHD ETF inflows have soared this year
SCHD has also attracted substantial capital from investors, with its net inflows rising by over $12 billion. This increase has brought its total assets to over $96 billion. Its inflows this year are higher than those of other top dividend ETFs DGRO and VYM.
SCHD has done well despite having a limited exposure to the artificial intelligence supercycle. Instead, most of its companies are concentrated in traditional industries like consumer staples, healthcare, energy, and industrials.
UnitedHealth Group has become its biggest constituent, accounting for a 4.50% of its holdings. UNH stock has staged a phoenix-like recovery after going through a major turmoil that dragged its stock to a low of $234 last year. It has now jumped by over 80% from its lowest point that year, with its market capitalization soaring to over $388 billion.
READ MORE: UNH jumps 7% as UnitedHealth's earnings beat silences cost fears
UnitedHealth’s surge mirrors that of other insurance companies. Humana stock has soared by 133% from its lowest point this year, while Elevance Health has jumped by 43%. Centene and Molina Healthcare have also jumped in the past few months.
Merck, a top player in the healthcare industry, has become SCHD’s second-biggest company as the stock has jumped by 65% from its 2025 lows and is slowly nearing its all-time high.
The other top names in the SCHD ETF are companies like Home Depot, Abbott Laboratories, Procter & Gamble, Amgen, Coca-Cola, and Verizon Communications. All these companies have limited exposure to the AI boom that has powered other ETFs like the VOO and DRAM this year.
As a result, it is being seen by market participants as a technical hedge against the AI sell-off. Its investors believe that value companies will do well if the boom in the AI starts to end. A good example of this is what happened earlier this year when it jumped to a record high as top AI names retreated.
SCHD ETF stock technical analysis
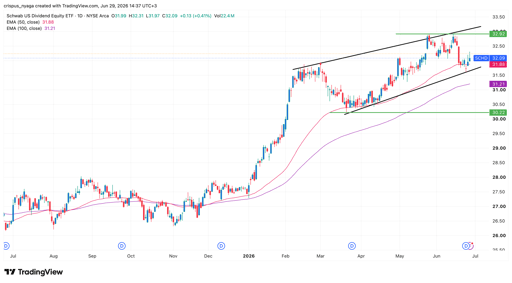
Schwab US Dividend Equity ETF chart | Source: TradingView
The daily chart shows that the Schwab US Dividend Equity ETF has done well after bottoming at $30.2 in March. It has formed an ascending channel and is now hovering slightly above its lower side. In most cases, bull markets tend to start whenever an asset bounces above the lower side of the channel.
SCHD has held steady above the 50-day and 100-day moving averages. It also formed a cup-and-handle pattern, a common bullish continuation sign in technical analysis.
Therefore, the stock will likely continue rising as bulls target the year-to-date high of $32.92. A move above that level will point to more gains, potentially to the next psychological level of $35.

Nikkei 225 rebounds sharply as AI earnings become market’s next big test

Brent crude price analysis: Is the market being too complacent?

Trump’s Canada tariffs: 4 stocks facing the biggest cross-border shock

Josh Brown names top dividend stocks to own in 2026

Dow falls 290 points as Nasdaq steadies on chip rebound, earnings focus
No results found
Loading articles...
Failed to load articles. Please try again.