
Ravencoin price crashes 22%: how low can RVN go from here?

AI Sentiment: 12/100 Bearish
This score is generated through AI-driven analysis of the article's content.

powered by

Sell RVN. The network consensus dispute means confirmed transactions can reverse, exchanges are suspending deposits/withdrawals, and the market has no nearby support after breaking $0.00288. Technicals point to continuation: next downside target is ~$0.00191 (2.618 fib), with heavy resistance overhead from the $0.0035–$0.0042 volume shelf.
Key Risk: The competing chain wins cleanly and quickly, exchanges fully reopen, and RVN reclaims $0.00288–$0.00295, triggering a fast relief rally that traps shorts/sellers.
Sell RVN on any exchange where transfers are still available; avoid holding coins that can’t move. The catalyst is not just price—it’s settlement risk (reorg up to ~3 days) plus mempool non-return, which keeps liquidity thin and forces forced selling when withdrawals reopen.
Key Risk: A clear, uncontested resolution emerges (dominant chain accepted by the network) and transfer/deposit/withdrawal functionality returns without further reorg surprises.
- RVN fell more than 22% to a new all-time low near $0.0027.
- Upbit and Bitget suspended RVN transfers.
- RVN's breakdown below $0.00288 puts $0.00191 in focus.
Ravencoin price has fallen more than 22% over the past 24 hours to a new all-time low near $0.0027 after a consensus vulnerability put several days of network transactions at risk.
According to CoinGecko, RVN dropped from a 24-hour high of roughly $0.00353 to as low as $0.00275 on August 12, while trading volume surged as holders reacted to uncertainty over the Ravencoin blockchain.
The token was trading near $0.00272 at the time of writing, extending losses after an initial attempt to stabilize above $0.0028.
The sell-off followed Ravencoin's disclosure on Tuesday that vulnerable nodes had accepted invalid blocks because of an exploit affecting the network's consensus rules.
Ravencoin identified block 4,487,776 as the first known instance of the exploit, which appeared on August 7.
Similar invalid blocks were produced after the vulnerability was demonstrated on the mainnet, according to the project.
Unlike an exploit limited to a wallet or decentralized application, the vulnerability has raised questions over which version of Ravencoin's blockchain should remain valid.
Mining pools 2Miners and RavenMiner have responded by building a competing chain from block 4,487,775, the last block before the known exploit began.
Ravencoin said the two pools control a majority of the network's hash rate and are excluding the affected branch as they work on the alternative chain.
If that chain gains enough mining support to become dominant, Ravencoin could experience a blockchain reorganization covering roughly three days of activity.
The project warned that transactions confirmed after block 4,487,775 could consequently be reversed.
Transactions removed during the reorganization may also fail to return automatically to the mempool, meaning they would not necessarily be included again without further action.
With the network attempting to settle on an uncontested chain, Ravencoin recommended that exchanges suspend deposits and withdrawals until conditions stabilize.
Upbit subsequently halted RVN deposits and withdrawals while keeping spot trading available. Bitget also suspended RVN transfers as the network issue remained unresolved.
Selling intensified alongside the exchange restrictions. CoinGecko's intraday chart shows RVN initially plunging from around $0.0035 toward $0.0029 before spending several hours between roughly $0.0028 and $0.0030.
A second leg lower on August 12 then pushed the token toward $0.0027 and into fresh record-low territory.
RVN price analysis
Ravencoin's daily chart has broken below a key Fibonacci extension at $0.00288, while the 4-hour chart shows price trading beneath the lower boundary of its Keltner Channel.
Together, the two charts leave RVN without an established historical support level immediately below its current price.
On the daily RVN/USDT chart, a Fibonacci extension drawn from the previous $0.00445 swing high through the $0.00348 low places the 1.618 extension at approximately $0.00288.
See below:
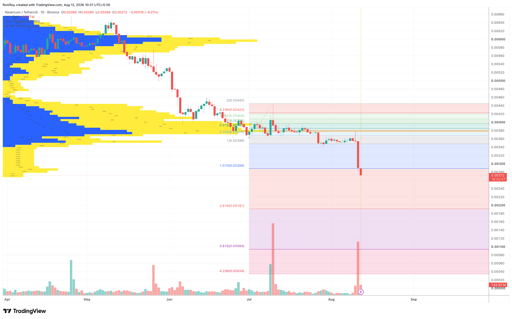
RVN/USDT 1-day price chart. Source: TradingView.
RVN has already fallen below that level, with the price near $0.00272 at the time of writing.
If RVN fails to reclaim $0.00288, the same Fibonacci structure places the next major downside extension at around $0.00191, the 2.618 level.
A move to that target would require another decline of roughly 30% from $0.00272.
Under a more severe sell-off, the 3.618 Fibonacci extension sits near $0.00094, which would only become relevant if RVN loses $0.00191 and selling continues without a durable recovery, while the much lower 4.236 extension near $0.00034 represents an extreme downside level rather than an immediate target.
The daily Volume Profile Visible Range also shows why a recovery could face resistance before the previous trading range is restored.
Much of the visible trading activity has accumulated above the current market price, including a dense volume region around $0.0035 to $0.0042.
With RVN now below that zone, former areas of active trading could act as resistance during a rebound.
The 4-hour chart shows similarly heavy downside pressure. RVN was trading around $0.00272, below the Keltner Channel's lower band near $0.00295.
See below:
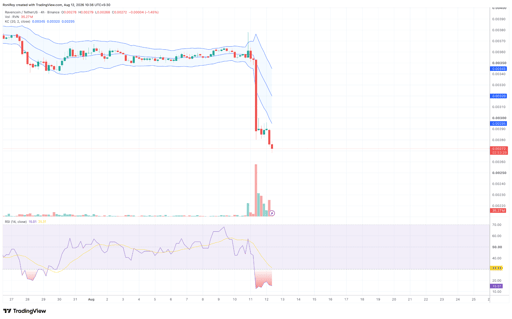
RVN/USDT 4-hour price chart. Source: TradingView.
The channel's middle and upper bands stood around $0.00320 and $0.00345, leaving the price well outside the lower end of its recent volatility range.
At the same time, the 4-hour Relative Strength Index had fallen to about 15, far below the conventional oversold threshold of 30.
Its RSI moving average remained considerably higher at roughly 31.
Such an extreme RSI reading shows that downside momentum has become stretched, which can increase the probability of a short-term relief move.
It does not by itself establish a bottom, particularly while the security-related catalyst remains unresolved and price continues making new lows.
For an initial recovery signal, RVN would first need to regain the $0.00288-$0.00295 area, where the breached 1.618 Fibonacci extension and lower Keltner band are located.
A stronger rebound would put $0.00320, the Keltner midline, back into focus, followed by the upper band near $0.00345.
Until then, the daily Fibonacci structure leaves $0.00191 as the next major technical downside target after the loss of $0.00288.

XRP has 11 days of ETF inflows, but is that enough to break the $1.40 ceiling?

XRP dips to $1.32 despite 11-day spot ETF inflow streak

How high can PI price go as Protocol 27 upgrade nears?

Bitcoin’s $82,000 test is coming as one major market signal turns bullish

Ethereum slips toward $2,400: key ETH levels to watch if support breaks
No results found
Loading articles...
Failed to load articles. Please try again.