
SHIB is down nearly 23% from its August high: can buyers stop the slide?

AI Sentiment: 22/100 Bearish
This score is generated through AI-driven analysis of the article's content.

powered by

Buy SHIB spot around $0.00000450–$0.00000462 as a bounce setup: price is below the 50/100/200-day EMAs (downtrend), but RSI ~40 shows weakening momentum without being fully oversold, and the $0.00000450 pivot + nearby Fibonacci support is the most likely area for dip buyers to defend. Target a reclaim of the $0.00000465–$0.00000495 resistance cluster (50-day EMA → 100-day EMA).
Key Risk: SHIB breaks and daily-closes below $0.00000450, turning the support into a runway to $0.00000405.
Sell SHIB perpetual futures into the $0.00000462–$0.00000495 resistance zone (Fib 78.6% + 50-day EMA + near-term upside cap). Rationale: open interest is rising while price is falling, which often precedes sharp volatility and liquidation-driven wicks; funding has eased, so longs may be less willing to chase, making rallies more likely to fail. Target rejection back toward $0.00000450, then $0.00000405.
Key Risk: A daily close above ~$0.00000495 that forces shorts to cover and triggers a squeeze higher.
- Shiba Inu trades around $0.00000450 after falling for seven consecutive days.
- The positive funding rate indicates growing demand for leveraged long positions.
- SHIB faces resistance at $0.00000462, while $0.00000405 is the next support.
Shiba Inu SHIB is trading near $0.00000450 on Wednesday, extending its decline for a seventh consecutive day as a weak technical structure keeps sellers in control.
The meme coin has dropped approximately 23% from its August high of $0.00000583. It also trades nearly 34% below the June peak of $0.00000671, reflecting the depth of its broader correction.
Despite the persistent decline, activity in SHIB’s derivatives market continues to increase, suggesting that speculative traders remain interested in the token.
SHIB futures open interest approaches twice its July low
Shiba Inu perpetual futures open interest is down by 2% in the last 24 hours and now stands at $50.35 million.
The latest figure is approximately 81% above the July low of $27.8 million, highlighting a significant recovery in derivatives activity.
Rising open interest means traders are committing additional capital to SHIB futures. However, the metric does not indicate whether these new positions are predominantly bullish or bearish.
When open interest increases while the underlying asset declines, it can also raise the risk of sharp volatility and leveraged liquidations.
SHIB’s open-interest-weighted funding rate decreased to 0.003% on Wednesday from 0.0082% on Tuesday.
A positive funding rate means long-position holders are paying traders with short positions, indicating stronger demand for bullish exposure.
However, the decrease in the funding rate suggests retail traders may be reducing their long exposure in the market.
If this demand resumes and is supported by stronger spot-market activity, it could help SHIB absorb some of the prevailing selling pressure.
However, growing long exposure during a downtrend also creates the risk of a long squeeze. Further price declines could force leveraged bullish traders to close their positions, intensifying the sell-off.
As derivative activity is declining, so is the trading volume. Volume reached $50.2 million on Tuesday but has now declined by nearly 17% and currently reads $41.21 million.
The volume remains substantially below the $859.5 million recorded on July 27—the highest level since June 2025.
The weak volume suggests that broader market participation remains limited. Without stronger spot buying, rising futures activity alone may not be sufficient to support a durable recovery.
A significant increase in volume would provide greater confirmation that buyers are returning and could help SHIB challenge its nearby resistance levels.
Shiba Inu technical outlook: SHIB downtrend remains intact
Shiba Inu maintains a strong bearish bias at $0.00000450 as it trades below its descending 50-day, 100-day and 200-day Exponential Moving Averages.
This moving-average structure shows that sellers remain in control across multiple time frames. SHIB would need to reclaim these averages to ease the prevailing bearish pressure.
The 4-hour Relative Strength Index has declined to 40, below its neutral midpoint of 50 but above the oversold threshold of 30.
The reading confirms weakening momentum while indicating that SHIB still has room to fall before becoming technically oversold.
If the RSI continues lower, dip buyers may begin entering the market. However, an oversold reading would not guarantee an immediate reversal.
The 78.6% Fibonacci retracement level at $0.00000462 provides immediate resistance, followed closely by the 50-day EMA at $0.00000465.
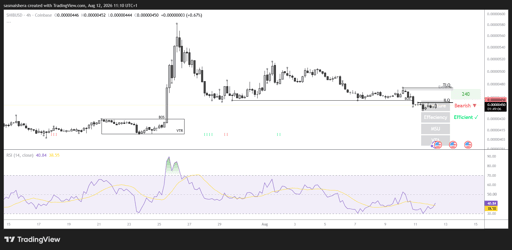
A daily close above this resistance cluster could reduce short-term selling pressure and allow SHIB to target the 100-day EMA at $0.00000495.
On the downside, $0.00000450 serves as the immediate pivot and 100% Fibonacci retracement level. A decisive close below it could extend the decline toward the next significant support at $0.00000405.
Until SHIB reclaims its key moving averages with stronger trading volume, any rebound is likely to remain corrective within the broader downtrend.

Can ARB price reach $0.14 after 30% rally powered by Robinhood chain?

BONK jumps 7% as rising futures demand supports a breakout attempt

Robinhood stock rises as Morgan Stanley upgrades HOOD to overweight

XRP price slips despite 10-day ETF inflow streak: is a breakout still coming?

Bitcoin price rises, but why is $80K proving so hard to break?
No results found
Loading articles...
Failed to load articles. Please try again.