
Solana gets MoneyGram boost as ETF buyers return: can SOL break $80?

AI Sentiment: 72/100 Bullish
This score is generated through AI-driven analysis of the article's content.

powered by

MoneyGram Ramps going live on Solana is a real utility upgrade for fiat on/off-ramps, and the tape is confirming: spot SOL ETF demand is returning and derivatives are turning bullish (long/short near 1; positive funding). Buy SOL and target a close above $78.40 (100-day EMA) to push toward $89.98, then $96.19. Key risk: ETF inflows stall or reverse and SOL loses the $75.53 (50-day EMA), flipping momentum back to sellers.
Key Risk: ETF inflows reverse and SOL breaks below the 50-day EMA ($75.53).
Play the same catalyst with defined risk: buy a SOL call spread with the long strike just above $78.40 and the short strike near $89.98. This benefits if SOL clears the 100-day EMA and re-rates toward the next major resistance, while limiting damage if it chops below $78.40. Key risk: SOL fails to reclaim $78.40 and mean-reverts under $76, collapsing the probability of reaching $89.98.
Key Risk: SOL fails to break above $78.40 and falls back below $76, killing upside odds.
- Solana is trading above $76 after rebounding from a key support zone.
- MoneyGram Ramps is live on Solana, bringing cash deposits in over 25 countries.
- SOL faces resistance at $77.07 and $78.40, with support at $75.53 and $72.70.
Solana (SOL) extends its recovery on Wednesday, trading above $76.1 after buyers defended a key support area during the previous session.
The rebound is supported by improving fundamental and market conditions.
MoneyGram’s integration with Solana has strengthened optimism around the network’s payment utility, while continued inflows into spot SOL exchange-traded funds indicate sustained institutional demand.
Derivatives traders are also becoming more optimistic, although SOL remains below important moving averages that could limit the immediate recovery.
MoneyGram Ramps goes live on Solana
Solana announced on Tuesday that MoneyGram Ramps is now live on its network.
BREAKING: @MoneyGram Ramps is live on Solana.
— Solana (@solana) August 11, 2026
60M+ customers, nearly 500,000 retail locations, 170+ countries. One of the world's largest payments networks is now a single API away for every builder on Solana. pic.twitter.com/TSOhIpBjvz
The integration gives developers direct access to MoneyGram’s global fiat on-ramp and off-ramp infrastructure through a single application programming interface.
According to the announcement, Solana-based applications, wallets and exchanges can now support cash deposits in more than 25 countries and withdrawals across over 170 countries and territories.
“60M+ customers, nearly 500,000 retail locations, 170+ countries. One of the world’s largest payments networks is now a single API away for every builder on Solana,” the network said.
The partnership could make it easier for users to move between cash and digital assets without relying exclusively on bank transfers or payment cards.
MoneyGram’s global retail network gives Solana developers access to payment infrastructure that already serves millions of customers.
The integration could support broader adoption of Solana-based wallets, applications and exchanges by simplifying fiat-to-crypto and crypto-to-fiat conversions.
It may be particularly useful in regions where cash remains widely used or access to traditional banking services is limited.
Although the development is unlikely to affect SOL’s price immediately on its own, it strengthens the network’s long-term utility by connecting blockchain applications with real-world payment channels.
Institutional demand for Solana has remained positive so far this week.
US-listed spot SOL ETFs recorded no inflows on Tuesday after attracting $8.80 million on Monday, according to SoSoValue.
The products therefore accumulated approximately $10.26 million over the two sessions.
Continued ETF inflows could support SOL by increasing regulated investment demand and helping absorb available market supply.
However, the sustainability of the recovery will depend on whether those inflows continue and strengthen through the remainder of the week.
Solana’s derivatives indicators also point to improving market sentiment. CoinGlass data shows that SOL’s long-to-short ratio stands at 0.9932 on Wednesday, approaching its highest level in more than a month.
The reading is approaching one, indicating that long positions are growing and now outnumbering short positions, suggesting traders expect the price to rise.
Solana’s funding rate also turned positive on Tuesday and reached 0.0017% on Wednesday.
Positive funding means long-position holders are paying short-position holders to keep their trades open, reflecting greater demand for bullish exposure.
While the readings remain moderate, their improvement alongside the price rebound and ETF inflows supports the constructive near-term outlook.
Solana technical forecast: SOL holds above 50-day EMA
SOL trades near $76.1, marginally above its 50-day Exponential Moving Average at $75.53.
Holding this level is important because it provides immediate dynamic support and helps preserve the latest recovery attempt.
The former rising trendline resistance near $72.70, which SOL has reclaimed, provides a deeper structural support zone.
However, the price remains below the 100-day EMA at $78.40 and the 200-day EMA at $89.98.
These moving averages indicate that the broader technical structure remains constrained despite improving short-term momentum.
The Relative Strength Index is hovering near 55, above its neutral midpoint of 50. This suggests buying pressure is strengthening without placing SOL in overbought territory.
The Moving Average Convergence Divergence indicator is also moving further into positive territory, reinforcing the view that bullish momentum is gradually improving.
If the rally persists, SOL faces initial resistance at $77.07, followed closely by the 100-day EMA at $78.40.
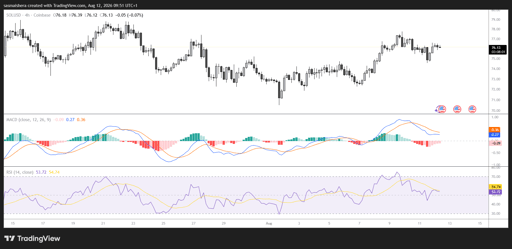
A decisive close above these barriers could strengthen the recovery and open the path toward the 200-day EMA at $89.98.
Beyond that, the horizontal resistance level near $96.19 would become the next major target.
Conversely, a break below the 50-day EMA at $75.53 could weaken the bullish outlook and trigger another test of the former trendline breakout zone near $72.70.

Can ARB price reach $0.14 after 30% rally powered by Robinhood chain?

BONK jumps 7% as rising futures demand supports a breakout attempt

Robinhood stock rises as Morgan Stanley upgrades HOOD to overweight

XRP price slips despite 10-day ETF inflow streak: is a breakout still coming?

Bitcoin price rises, but why is $80K proving so hard to break?
No results found
Loading articles...
Failed to load articles. Please try again.