
Here’s why the Nikkei 225 Index is slumping as Japan 30-year bond yield jump

AI Sentiment: 18/100 Bearish
This score is generated through AI-driven analysis of the article's content.

powered by

Buy USD/JPY (e.g., via FX pair or a USD/JPY ETF/ETN). The yen is under pressure (USD/JPY ~159.36 vs 155.23 lows) because prior interventions “backfired” and the market expects further BoJ tightening to narrow the US–Japan rate gap. Higher oil and inflation also keep pressure on Japan to move rates, supporting USD/JPY strength in the near term.
Key Risk: Japan intervenes again effectively or BoJ hikes sooner/more than priced, causing USD/JPY to drop sharply.
Sell Nikkei 225 exposure via iShares Nikkei 225 ETF (EWJ) or a Nikkei 225 futures short. The article ties the selloff to a clear driver: 30-year JGB yields jumping (4.11%) and rising odds of BoJ hikes, which typically compress equity multiples—especially for long-duration tech and banks. With RSI rolling over and price back below the 50-day EMA, the path of least resistance is bearish toward ~62,500.
Key Risk: BoJ signals a slower, less aggressive hike path and JGB yields fall fast, reversing the multiple-compression trade.
- The Nikkei 225 Index plunged sharply as Japan bond yields soared.
- Mizuho analysts predict faster BoJ interest rate hikes.
- There are signs that the US and Iran war will resume soon.
The Nikkei 225 Index retreated sharply on Wednesday, reaching its lowest level since August 10 as Japan bond yields soared. It also fell as analysts positioned themselves for the potential Bank of Japan (BoJ) hike and potential resumption of US-Iran kinetic action. It was trading at 65,684 points, down modestly from this week’s high of 69,622.
Japan bond yields surge on BoJ rate hike expectations
The Nikkei 225 Index has slumped in the past few days as investors focused on the rising Japan bond yields. The 30-year government bond yield soared to 4.11%, its highest level since May 20th. Similarly, the five-year has jumped to 2.13%.
The same trend his happening globally, where long-term yields are in a strong uptrend. In the US, it jumped to its highest level in 20 years. In Germany, the five-year yield jumped to 3.79% from the pandemic low of below 1%.
These numbers have jumped as concerns about the economies have soared. For one, there is a risk that the US-Iran war will restart anytime soon as the two sides are not in a ceasefire and the latter believes that it has an upper hand. The rising odds of fighting explains why crude oil prices have jumped, with Brent hitting $91.8 and the West Texas Intermediate (WTI) moving to $85.
Rising oil prices will lead to higher inflation in Japan and other countries. That, will, in turn, put more pressure on the BoJ to start hiking interest rates in the near future. In a statement on Tuesday, analysts at Mizuho predicted that the bank would hike interest rates soon and more often.
In addition to the rising inflation, the BoJ may decide to hike rates because of the ongoing Japanese yen performance. The USD/JPY pair was trading at 159.36 on Wednesday, up sharply from this month’s low of 155.23. Its performance is a sign that the US and Japan’s interventions earlier this month backfired.
Analysts believe that the Japanese yen will remain under pressure in the foreseeable future until the BoJ hikes interest rates further to bridge the gap with the US.
Most Nikkei 225 Index companies were in the red today, with technology names being the top laggards. Softbank, Kioxia, and Tokyo Electron dropped by 7.48%, 8.38%, and 2.16%, respectively. Other top names like Mitsubishi UFJ, Toyota, and Hitachi were down by over 4%.
Nikkei 225 Index technical analysis
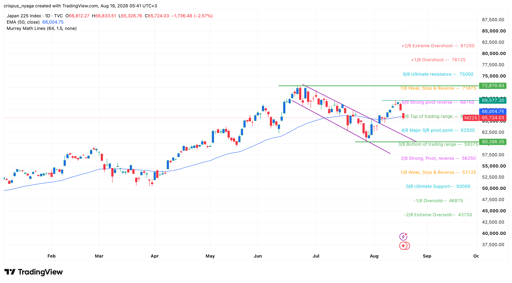
Nikkei 225 Index | Source: TradingView
The daily chart shows that the Nikkei 225 Index has slipped sharply in the past two days. It dropped to 65,724 points, down modestly from this month’s high of 69,577.
It has slumped to the 50-day Exponential Moving Average (EMA) and the top of the trading range level of the Murrey Math Lines tool. Also, the Relative Strength Index (RSI) has pointed downwards in the past few days.
Therefore, the path of the least resistance is bearish, with the next key target to watch being the Major S/R pivot point at 62,500.

Samsung, SK Hynix stocks sink 9%: why Micron’s rout is spreading to South Korea

Dow closes 110 points as bond yields rise and semiconductor stocks slide

Evening digest: Meta's chils safety trial begins, oil surges

Amylyx stock soars on GLP-1 success: here's why investors should sell

MU stock falls 7% as memory stocks face the heat
No results found
Loading articles...
Failed to load articles. Please try again.