
The Trade Desk stock: Bullish patterns emerge despite mounting business woes

AI Sentiment: 68/100 Bullish
This score is generated through AI-driven analysis of the article's content.

powered by

Buy TTD. The chart shows an island reversal after a big down-gap, RSI bullish divergence (27→36), and a MACD bullish crossover—classic “selling pressure is fading” signals. Valuation is also extreme: forward P/E ~11.6 vs sector ~13.6 and a much higher 5-year average, plus an active buyback ($78M repurchased; $269M remaining). Target $20 (psych level) from ~$13.5. Thesis killer: TTD breaks below the YTD low (~$13), confirming the pattern failed and the downtrend resumes.
Key Risk: TTD trades below ~$13 and the island-reversal setup breaks.
Buy TTD specifically for the “fundamentals-to-price” effect: analysts cut estimates, but the company is using repurchases to mechanically support the stock while sentiment is worst. With forward revenue still pressured, the market will keep overreacting—until buybacks and cheap multiples start to matter more than near-term misses. Thesis killer: the company pauses or shrinks buybacks because cash flow deteriorates faster than expected.
Key Risk: TTD reduces/halts share repurchases due to worsening cash flow.
- The Trade Desk stock has formed an island reversal pattern.
- It has also formed a bullish divergence pattern as evidenced by the RSI and MACD.
- The company has become a bargain as its struggles continue.
The Trade Desk stock has been in a freefall this year and is hovering at the lowest level since January 2019. It has slumped from a record high of $141 to the current $13.5, with its market cap falling from a record high of $63.35 billion to the current $6.38 billion. This retreat has made it a bargain in key metrics, with the island reversal pattern pointing to a rebound.
The Trade Desk stock is showing bottoming signs
Technicals suggest the TTD stock is showing bottoming signs, which may lead to a strong bullish breakout in the near term. The most notable one is the fact that it formed a big down-gap earlier this month when it published its financial results. After that, it has remained inside a narrow range, forming an island reversal pattern, a common bullish reversal sign in technical analysis.
The Relative Strength Index (RSI) has started forming a bullish diverge pattern as it moves from a low of 27 on August 10 to the current 36. Similarly, the two lines of the MACD indicator have formed a bullish crossover pattern, a sign that investors have started to accumulate the stock.
Therefore, the stock will likely rebound, potentially to the psychological level of $20. A drop below the year-to-date low of $13 will invalidate the bullish outlook.
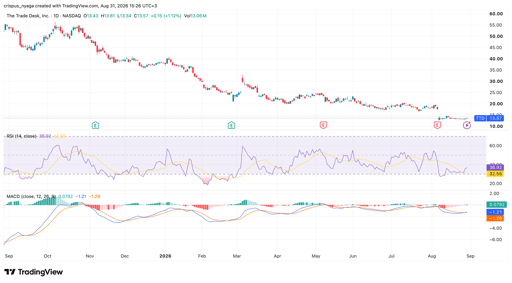
TTD stock chart | Source: TradingView
The Trade Desk published weak financial results
The TTD stock has slumped after the company published weak financial results, which missed its own expectations and those of its analysts.
Its results showed that its revenue rose modestly in the quarter to $715 million from $694 million in the same period last year. Its half-year revenue rose by 7% to $1.4 billion, while its forward estimates were subdued. It was the second consecutive quarter that the company’s earnings came short of expectations.
Since then, analysts have reduced their estimates. Now, analysts estimate that the third-quarter revenue will come in at $650 million, down by 12% from a year earlier. It will then weaken by 18% to $693 million, bringing its annual revenue down by 5.2% YoY to $2.7 billion.
The management is working on turning around its business. For example, it has inked some major deals with companies like Dentsu and Databricks, and moved into the travel industry.
These numbers have made it a highly undervalued company. It has a forward price-to-earnings ratio of 11.6, down sharply from the five-year average of 53. It was also lower than the sector median of 13.6. This cheap valuation explains why the company is boosting its share repurchase program. It repurchased shares worth $78 million in the second quarter and has $269 million available to buy.
Therefore, there are two main potential scenarios for the stock. It may continue moving downwards amid its business struggles. Alternatively, technicals suggest that it may bounce back in the near term since it has formed a bullish divergence and an island reversal.

Nvidia stock rises as company announces $3.5B investment in MediaTek

Credo Technology stock: Insider selling meets options market jitters before earnings

OpenAI says its ads business has hit $1B run-rate

BofA names 3 stocks with meaningful upside in September

GameStop preliminary Q2 report: does it change the investment thesis?
No results found
Loading articles...
Failed to load articles. Please try again.