Bitcoin rebounds from $59K, but bears still control the next move

AI Sentiment: 18/100 Bearish
This score is generated through AI-driven analysis of the article's content.
powered by
Buy BTC spot. The key setup is forced deleveraging: $850M+ in crypto long liquidations and BTC retesting the $59k support that previously sparked rebounds. If $59k holds, the next move is typically a squeeze toward the next liquidation/volume pocket ($61.7k–$62.3k, then $63k–$64k).
Key Risk: BTC breaks and closes below $59,000, triggering another long-liquidation cascade toward the upper $58k and ~$57.3k liquidity pockets.
Sell MSTR. The article shows Strategy’s BTC buying pace collapsed (520 BTC—smallest in ~18 months) while it sold equity and rebuilt cash, and the stock is trading below the cost basis of its BTC reserves. That mix usually means less incremental BTC demand plus ongoing equity pressure—bad for the leveraged BTC proxy.
Key Risk: MSTR re-rates fast if BTC reclaims and holds above the 20-day EMA (~$64.3k) and the market starts absorbing ETF/derivatives selling again.
- Bitcoin has recovered above $60K, but technical indicators still favor sellers.
- Concerns around Strategy has kept bullish momentum in check.
- Liquidation data points to $62K as the next upside target.
Bitcoin has fallen below the $60,000 level before recovering to around $61,000, although several macroeconomic and market pressures have kept traders cautious about the flagship cryptocurrency's next move.
According to market data, Bitcoin briefly dropped to as low as $59,060 before rebounding above $60,800 over the past 24 hours.
The decline retested the same support area near $59,000 that helped spark Bitcoin's rebound earlier this month.
Despite the bounce, sentiment has remained fragile as traders weigh corporate financing developments, ETF outflows, and upcoming US economic data.
Strategy financing, ETF outflows add pressure to Bitcoin
Strategy shares came under pressure after both its perpetual preferred stock, STRC, and common stock, MSTR, fell below the $100 level, fueling concerns that the company's aggressive Bitcoin buying pace could slow.
The decline in STRC, which carries an 11.5% annual dividend, also prompted comparisons on social media to the collapse of TerraUSD.
TerraUSD promised 20% yield backed by nothing but new inflows. $STRC offers 11.5% backed by 767,000 Bitcoins.
— J. P. Mayall (@jpmayall) April 8, 2026
Same category. Opposite architecture. pic.twitter.com/LS5oCKnkSm
Recent SEC filings showed Strategy bought just 520 BTC for about $35 million (approx. £26.5 million) during the week ending June 21, its smallest weekly purchase in about 18 months, while also selling $335.5 million (approx. £254 million) worth of equity shares.
Around $300 million (approx. £227.1 million) of those proceeds went toward rebuilding the company's cash position, increasing its cash reserves to about $1.4 billion (approx. £1.1 billion).
Although many analysts dismissed the comparisons to TerraUSD, saying Strategy's roughly $1.4 billion (approx. £1.1 billion) cash reserve provides sufficient flexibility to meet dividend obligations on STRC, the combination of weaker share prices, a slower pace of Bitcoin purchases, and concerns over the company's financing strategy weighed on retail sentiment.
Pressure on Bitcoin subsequently intensified as leveraged positions unwound across the market.
Derivatives data showed more than $850 million (approx. £643.4 million) in crypto long positions were liquidated over the past day, including more than $400 million (approx. £302.8 million) tied to Bitcoin after the cryptocurrency lost the $60,000 level.
Against this backdrop, there wasn’t sufficient Institutional demand to absorb the selling.
Heavy net outflows from spot Bitcoin ETFs coincided with disappointment that Strategy's stock was trading below the cost basis of its Bitcoin reserves, adding another headwind for market sentiment.
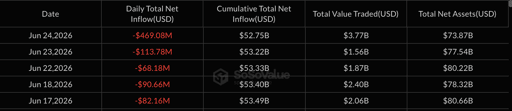
Bitcoin ETF outflows since June 17. Source: SoSoValue.
Away from crypto-specific developments, macroeconomic conditions continued to favor defensive positioning.
The US dollar climbed to its strongest level against a basket of major currencies in 13 months after easing geopolitical tensions reduced inflation concerns.
Oil prices retreated sharply following a memorandum of understanding between the US and Iran that temporarily reopened the Strait of Hormuz, while gold slipped below $4,000 for the first time in seven months as Brent crude dropped under $74.
Economic data also reinforced expectations that US interest rates could stay elevated.
Weekly unemployment benefit claims fell by 4,000, suggesting the labor market remains resilient, while traders continued to wait for the May Personal Consumption Expenditures inflation report, the Federal Reserve's preferred inflation gauge, for additional clues on monetary policy.
Although the US M2 money supply expanded to $23.1 trillion (approx. £17.4 trillion) in May from $22.8 trillion (approx. £17.3 trillion) a month earlier, investors have continued favoring technology shares and fixed income assets over alternative stores of value.
Bloomberg market data also showed capital rotating into newly listed equities and artificial intelligence companies after strong earnings from memory chip maker Micron, whose market capitalisation has climbed to about $1.2 trillion (approx. £878.1 billion) following a 265% gain over the past six months.
Bitcoin price analysis
From a technical perspective, Bitcoin has recovered after sweeping liquidity below $60,000, but the broader trend continues to favor sellers.
The daily chart shows price trading below the 20, 50, 100, and 200 exponential moving averages, which sit around $64,300, $68,200, $71,500 and $77,200.
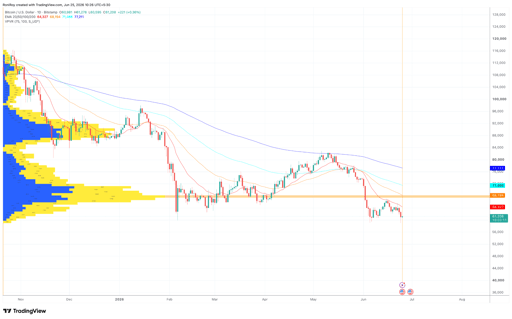
BTC/USD 1-day price chart. Source: TradingView.
Until Bitcoin reclaims at least the 20 day EMA, rallies could continue facing selling pressure.
Bitcoin’s Visible Range Volume Profile also shows the largest concentration of historical trading activity around the $68,000 region.
The high-volume node coincides closely with the 50-day EMA, making it an important resistance level that buyers would likely need to reclaim before momentum turns more constructive.
Simultaneously, the latest CoinGlass heatmap shows a dense cluster of short liquidations concentrated between roughly $61,700 and $62,300, making that zone a potential upside target if buyers maintain control.
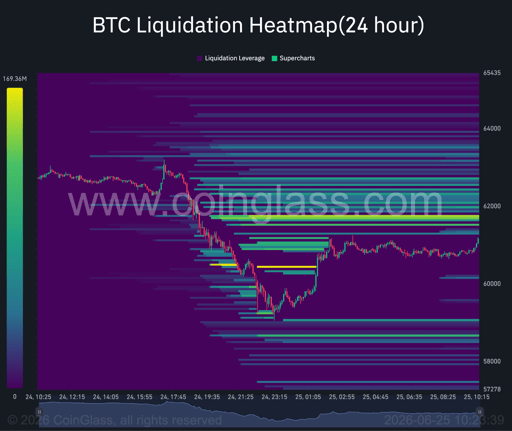
Bitcoin 24-hour liquidation heatmap. Source: Coinglass.
Additional liquidity extends toward the $63,000 to $64,000 area, where another round of forced short liquidations could accelerate a recovery.
Support, however, remains equally important. Liquidity pockets continue to sit below the market around the upper $58,000 region and near $57,300.
A break beneath $59,000 could therefore invite another wave of long liquidations before buyers attempt to stabilise the market again.

Coinbase, Circle stocks climb as analysts see Bitcoin-linked upside

Hedera (HBAR) price forecast: Bonzo exploit, Lloyds adoption

BONK price jumps on CPI relief: can bulls break the $0.0000040 wall?

Is Chainlink heading for $10 after its latest rally?

CRV price eyes 17% breakout as whales tighten supply across exchanges
No results found
Loading articles...
Failed to load articles. Please try again.