
Bitcoin price prediction as Crypto Fear and Greed Index jumps despite Strategy sales

AI Sentiment: 68/100 Bullish
This score is generated through AI-driven analysis of the article's content.

powered by

BTC is flipping resistance into support, breaking above the 25-day moving average, and reclaiming the falling-wedge area. With the Fear & Greed Index rising off extreme fear (13→30), flows typically turn risk-on and BTC targets $67,400 then $70,000. Buy spot BTC (or a liquid BTC ETF) while price holds above ~$59,000 support.
Key Risk: Strategy and other large holders keep dumping, turning this “stabilization” into a sustained selloff that breaks $59,000.
If Strategy’s cash push and ETF outflows persist, the market can rally on short-covering while liquidity stays tight. That environment often hurts miners first because margins are sensitive to difficulty, power costs, and sustained price strength. Sell miners like Marathon Digital (MARA) and Riot Platforms (RIOT) into the BTC bounce; they tend to underperform when rallies aren’t backed by strong net inflows.
Key Risk: BTC’s move becomes a real trend (ETF inflows return and BTC holds above $67,400), forcing miners to catch up fast.
- Bitcoin price rose to $64,000 as the recent recovery started.
- The Crypto Fear and Greed Index is approaching the neutral phase.
- It has formed a falling wedge pattern, pointing to more gains.
Bitcoin price has held steady in the past few days, moving from this month’s low of $57,725 to the current $64,000. It has flipped a crucial resistance level into a support, and formed a bullish pattern, pointing to more gains as the Crypto Fear and Greed Index rises.
Bitcoin price rises as the Crypto Fear and Greed Index jumps
BTC price has stabilized in the past few days, helped by the moderate risk-on sentiment in the industry. The Crypto Fear and Greed Index has jumped from the extreme fear zone of 13 last month to 30 today, and it is still rising.
This is an important gauge that is created by looking at several data points like momentum, volatility, derivative market data, and other proprietary numbers. In most cases, Bitcoin and other cryptocurrencies start rising whenever the index moves to the extreme fear zone.
Bitcoin rose despite some major negative news in the industry. The most notable one is that Strategy, the biggest accumulator, has started selling its coins. It sold 32 coins earlier last month, and increased the selling last week.
It has now dumped coins worth over $216 million, and is in the process of dumping more in the coming months. Strategy is doing this to improve the cash section of its balance sheet, which will enable it to pay dividends.
The urgency to boost its cash reserves jumped after its preferred stocks like STRC, STRK, and STRF dropped below their par levels. In the aftermath, Strategy decided to have a two-year dividend cover to boost investor confidence.
The biggest risk is that many Strategy copycats may also decide to sell their coins in the near future. This would be a big event in the crypto industry since these companies owns over 1 million coins. They include popular companies like Tesla, SpaceX, Strive, Gemini, and Block.
Bitcoin ETF outflows have started
Meanwhile, Bitcoin price is rising even as American investors restart selling their assets. Data shows that spot Bitcoin ETFs lost $95 million on Thursday after losing $84 million a day earlier. Before that, these funds had over $500 million in inflows.
The ongoing outflows could be a sign that these American investors expect the prices to remain under pressure in the near term.
Outflows jumped after the US and Iran restarted their war. The two sides have exchanged fire recently, with Trump saying that, in his view, the ceasefire agreement was over.
The risk, therefore, is that the two sides may continue fighting at a time when oil inventories are still low. Such a move would push oil prices higher. Brent and the WTI have jumped to $76 and $72, respectively.
Higher energy prices would push inflation higher, making it hard for the Fed to cut interest rates.
BTC price prediction: technical analysis
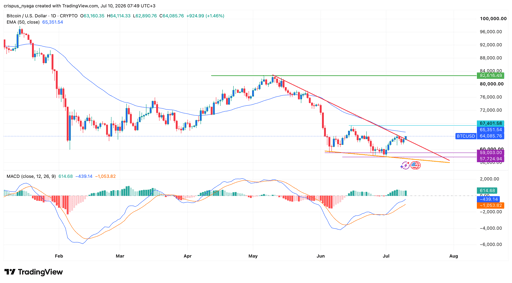
Bitcoin price chart | Source: TradingView
Technicals suggest that Bitcoin price may continue rising in the near term. It has moved slightly above the upper side of the falling wedge pattern. A wedge is made up of two descending and converging trendlines.
The coin has also formed a double-bottom-like pattern whose neckline is at $67,400. It jumped above the 25-day moving average. The two lines of the MACD indicator are attempting to cross the zero line.
Therefore, the coin will likely continue rising as bulls target the key resistance at $67,400. Moving above that level will point to more gains, towards $70,000. The bullish outlook will be confirmed if it drops below the key support of $59,000.

Plug Power stock forms a risky pattern as short-seller pressure builds

BitMine stakes 85% of its ETH: why $330M barely changes the risk equation

IAG share price eyes crash to 400p as jet fuel costs escalates

XRP price is flashing a 48% upside setup, but $1.50 must break first

Scottish Mortgage shares hit crucial price amid SpaceX, Anthropic catalysts
No results found
Loading articles...
Failed to load articles. Please try again.