
USELESS price risks 50% correction after 900% rally

AI Sentiment: 18/100 Bearish
This score is generated through AI-driven analysis of the article's content.

powered by

Buy downside protection via USELESS puts (or short USELESS perps with tighter risk) targeting $0.15–$0.17 and $0.10. The key is the $0.1483 liquidity magnet: once price tags that zone, forced long closures can accelerate selling into the next liquidation levels.
Key Risk: Price grinds higher and stays above $0.34–$0.35 long enough for longs to avoid liquidation, killing the cascade.
Sell USELESS (spot or perpetuals) into the $0.32–$0.34 broadening-wedge upper boundary. The 4H bearish RSI divergence + near-vertical 900% run + heavy leveraged longs below price sets up a liquidation cascade. Expect a drop toward $0.16–$0.17 (and possibly $0.1483 liquidity cluster).
Key Risk: USELESS cleanly breaks and holds above $0.35, squeezing shorts and invalidating the liquidation-driven pullback.
- USELESS has rallied more than 900% from its August low to approximately $0.337.
- A decline to $0.10 could expose nearly $6.7 million in cumulative long liquidations.
- Rejection from $0.34–$0.35 could send USELESS toward $0.16–$0.17.
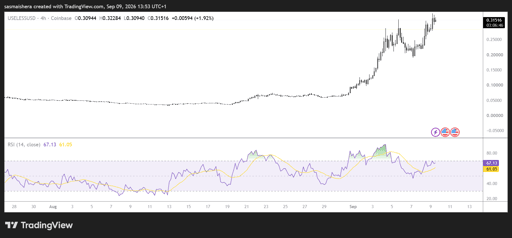
Useless, a Solana-based memecoin, has gained more than 900% from its August low to trade near $0.316 on Wednesday.
The rally carried USELESS to its highest level since October 2025 and placed the token among the strongest-performing memecoins over the period.
However, derivatives positioning and technical indicators warn that the advance may be becoming increasingly fragile.
Millions of dollars in leveraged long positions sit below the current price, creating the conditions for a potential liquidation cascade if USELESS begins to fall.
The token is also testing the upper boundary of an ascending broadening wedge while its Relative Strength Index displays a bearish divergence.
Together, these signals raise the possibility of a correction toward $0.16–$0.17, which would erase roughly half of USELESS’s current value.
Liquidation map shows heavy downside exposure
USELESS’s one-week liquidation heatmap reveals a significant imbalance between bullish and bearish leveraged positions.
If the token extends its rally to approximately $0.347, around $540,000 in cumulative short positions could be liquidated, according to CoinGlass data.
That potential short exposure is relatively small compared with the long positions sitting below the current market price.
A decline toward $0.10 could expose nearly $6.7 million in cumulative leveraged longs to liquidation. This means traders betting on further gains currently have much more capital at risk than those positioned for a decline.
The imbalance does not guarantee that USELESS will fall. However, it shows that a bearish move could generate considerably more forced activity than another modest increase.
The largest concentration of liquidity sits near $0.1483. Approximately $266,170 in long liquidations is concentrated at that specific price.
Cumulative long liquidations could reach roughly $4.46 million if USELESS drops from its current level to that zone.
Liquidation clusters can act as price magnets because traders, market makers, and automated systems are aware of the large number of positions vulnerable around them.
When an asset reaches a major cluster, exchanges automatically close leveraged positions belonging to traders who no longer have sufficient collateral to cover their losses.
Those forced closures create additional selling pressure. That pressure can push the price into the next group of liquidation levels, creating a cascading decline.
The risk is particularly significant after a near-vertical rally because many traders may have entered leveraged positions at increasingly elevated prices.
USELESS could lose up to 70%
A decline from $0.337 to the $0.1483 liquidity zone would represent a drop of approximately 56%.
If the price extends lower toward $0.10, the correction would reach roughly 70%. These levels are potential liquidation destinations rather than fixed price targets.
The heatmap estimates where leveraged positions could be closed if the market moves through those areas, but it does not predict that the price will necessarily reach them.
Still, the amount of downside exposure indicates that USELESS could experience sharp volatility if selling pressure begins to build.
A relatively small initial decline may force some long positions to close, potentially accelerating the move as additional liquidation thresholds are reached.
USELESS’s four-hour chart also displays an ascending broadening wedge. The formation consists of two diverging trendlines, with the price producing progressively wider highs and lows. It often reflects increasing volatility and weakening control by the prevailing trend.
Such a pattern can be especially concerning after an extended rally because it suggests that buyers and sellers are becoming increasingly aggressive while price action grows less stable.
USELESS is currently testing the wedge’s upper boundary around $0.32–$0.34 after rebounding from approximately $0.20.
A rejection from this trendline would strengthen the bearish scenario and could send the token toward the lower boundary of the formation.
Momentum has not confirmed USELESS’s latest price high. The token has produced a higher high on its four-hour chart, while the Relative Strength Index has formed a lower high compared with its previous peak.
This creates a bearish divergence.
The pattern indicates that the price is continuing to rise even as the momentum supporting the move weakens. Bearish divergences frequently appear before corrections, although they do not guarantee an immediate reversal.
USELESS could continue climbing despite the signal if buying volume remains strong. However, the divergence becomes more concerning when combined with the broadening wedge and the large concentration of leveraged longs below the market.
If USELESS is rejected from the wedge’s upper trendline, the price could retreat toward its lower boundary between $0.16 and $0.17.
The rising 100-period EMA on the four-hour chart sits near $0.163, strengthening that area as a potential support zone.
A decline from approximately $0.322 to $0.163 would amount to a correction of around 49%.
This target also sits relatively close to the major liquidation concentration around $0.1483. The alignment between technical support and leveraged positioning increases the importance of the broader $0.15–$0.17 region.
Buyers may attempt to defend that area if a correction occurs. Failure to hold it could expose the deeper $0.10 target and the remaining long liquidations below.
A break above $0.35 would weaken the bearish setup
The bearish outlook would lose strength if USELESS decisively breaks above the wedge’s upper boundary.
A sustained move beyond the $0.34–$0.35 resistance zone would invalidate or delay the expected correction and could trigger the relatively small cluster of short liquidations near $0.347.
For confirmation, the token would need to hold above the resistance area rather than producing a brief intraday spike.
Until that occurs, the combination of a 900% rally, bearish momentum divergence, and heavily concentrated long exposure leaves USELESS vulnerable to a sharp pullback.

Can BitMine’s ETH buying push Ethereum price toward $2,600?

BitMine stakes 85% of its ETH: why $330M barely changes the risk equation

XRP price is flashing a 48% upside setup, but $1.50 must break first

Bitcoin rebounds $1,500 from its intraday low: who keeps buying near $77K

Why is Hyperliquid price still rising after an $820 million token unlock?
No results found
Loading articles...
Failed to load articles. Please try again.