Ethereum rips past $2,300 as ETF inflows ignite fresh investor rush

AI Sentiment: 78/100 Bullish
This score is generated through AI-driven analysis of the article's content.
powered by
Buy spot Ethereum (ETH) targeting a retest of $2,500 then $2,746. Rationale: spot ETH ETF inflows ($69.77m Monday) plus rising futures open interest ($31.04b) signals real demand, not just short-covering. BitMine’s outsized weekly accumulation reinforces institutional bid. Technicals: price holding above 20/50-day EMAs with RSI ~50 and MACD near neutral—room to grind higher toward the 100-day EMA (~$2,354) and beyond.
Key Risk: ETF inflows reverse sharply (outflows) and ETH breaks below the $2,211/50-day EMA floor, turning the demand story into forced selling.
Buy an ETH upside call spread (e.g., buy 3-month $2,500 call, sell $2,800 call). Rationale: asymmetric upside into the $2,500 psychological level and the 100-day EMA area (~$2,354) while capping premium if momentum stalls. Second-order catalyst: rising OI with ETF inflows typically increases hedging demand from institutions, supporting call skew and making upside participation more likely than a clean spot-only move.
Key Risk: A volatility crush plus price stalling below $2,354/$2,500 as OI stops rising and ETF flows flatten.
- Ether is back above $2,300 as broader market shakes off Monday's dip.
- Altcoin could rally higher amid growing institutional and retail adoption.
- Ether could extend rally towards $2,746 resistance if bulls push higher.
The cryptocurrency market encountered a sell-off on Monday but has quickly bounced back, with most major coins now in the green.
Ethereum, the second-largest cryptocurrency by market cap, is trading above $2,300 once again after dropping below $2,250 on Monday.
Ethereum could continue its upward movement in the near term, supported by institutional and retail demand.
Institutions and retail traders resume ETH acquisition
ETH is up by 1% in the last 24 hours and is now trading above $2,300 per coin. The positive performance comes as the broader cryptocurrency market recovers from Monday’s dip.
Growing institutional and retail demand is also pushing ETH’s price higher.
Data obtained from CoinGlass’s ETF page reveals that spot Ethereum ETFs recorded an inflow of $69.77 million on Monday, following the massive inflows recorded last week.
In addition to that, Ethereum (ETH) treasury firm BitMine Immersion Technologies announced on Monday that it acquired 101,627 ETH last week, marking its largest weekly purchase since mid-December.
That amount is also about 42% greater than its average weekly acquisition over the past month.
The latest acquisition pushed BitMine's Ethereum stash to 4.97 million ETH, worth roughly $11.44 billion at the time of publication.
The company stated that it is 82% closer to its goal of acquiring 5% of the top altcoin.
According to BitMine Chairman Thomas Lee, the crypto winter is coming to an end. He stated that,
"We see growing signs that the 'mini-crypto' winter is coming to an end. As downside tail risks for the US-Iran war diminish, ETH has risen 41% from its early February lows."
"And ETH has outperformed the S&P 500 by 2,280 basis points since the war started and remains the single best-performing asset in the world (besides crude oil prices)," Lee added.
In our view, there is a lot of meaning to ETH being the best 'war-time store of value' and to ETH being the asset leading since the war started.
Furthermore, retail demand for Ethereum continues to increase.
Ether’s futures Open Interest (OI) reads $31.04 billion on Tuesday, up from the $28 billion recorded the previous day.
Ethereum price forecast
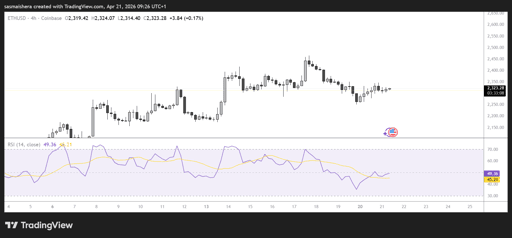
The ETH/USD 4-hour chart is bearish as Ether remains below the 100-day EMA in recent days.
Ether hit the $2,461 mark on Friday but failed to surpass the $2,500 psychological level, dropping below $2,250 on Monday.
However, Ether continues to trade above the 20-day and 50-day EMAs and could retest the $2,500 mark in the near term.
Momentum indicators back this tone, with the Relative Strength Index (RSI) near 50 and the MACD lines close to the neutral zone, both pointing to positive but not overextended upside pressure.
If the rally persists, initial resistance emerges at the 100-day EMA near $2,354.
An extended bullish scenario would bring the more distant resistance levels at $2,746 and $3,411 into focus in the near to medium term.
However, if the rally fails, immediate support lies at the 20-day EMA, followed by a dense floor formed by the convergence of the 50-day EMA and the $2,211 horizontal level.
The bulls would need to defend the $2,107 support level to maintain a bullish outlook on the 4-hour chart.

OKX (OKB) slides 2% amid crypto sell-off: key levels to watch

BNB price outlook: Binance Coin targets $647 as bullish pattern takes shape

US moves $297M in seized crypto to Coinbase Prime despite no-sell vow

Lido DAO explodes 12% as governance vote sends traders rushing into LDO

Pi Network crashes 10% as protocol upgrade fails to calm nervous traders
No results found
Loading articles...
Failed to load articles. Please try again.