XRP holds $1 as ETF inflows clash with weak price momentum

AI Sentiment: 58/100 Bullish
This score is generated through AI-driven analysis of the article's content.
powered by
Buy XRP (spot) around $1.03–$1.06. Thesis: ETF inflows are running seven straight weeks while futures are deleveraging (negative funding, lower open interest), which usually reduces forced selling and sets up a base. Price is holding the key $1 support and consolidating in a tight range, with resistance at $1.10–$1.15.
Key Risk: XRP breaks and holds below $1, triggering a fast move to $0.90 and invalidating the “base + reduced selling pressure” setup.
Sell/short XRP if it rejects $1.14–$1.17 (50% fib area) or fails to reclaim the $1.20–$1.31 EMA cluster. Thesis: long-term trend is still down (below 20/50/100/200-day EMAs) and the $1.13–$1.15 volume node is a known supply zone; ETF inflows may not be enough to flip the trend without a clean breakout.
Key Risk: XRP cleanly reclaims $1.20 and holds above it, turning the resistance cluster into support and squeezing shorts.
- XRP ETF inflows extended to seven straight weeks.
- A break below $1 could expose support near $0.90.
- Fibonacci levels placed $1.10 to $1.17 as the next resistance zone.
XRP has remained above the $1 support level despite losing more than 19% over the past month, while steady ETF inflows, rising network activity and a derivatives reset continue to shape the token's outlook.
According to CoinGecko data, XRP traded around $1.05 at the time of writing after slipping more than 7% over the past week.
The token changed hands between $1.04 and $1.07 over the previous 24 hours, ranking as the sixth largest cryptocurrency with a market capitalisation of roughly $65,4 billion (approx. R 1,1 trillion) and daily trading volume exceeding $1,1 billion (approx. R 18,8 billion).
Although XRP has stabilised near recent lows, the token remains well below its July 2025 record high of $3.65.
CoinGecko data also showed XRP has declined more than 50% over the past year and roughly 49% over the last 200 days, underscoring the persistent weakness in the long term trend.
However, XRP has continued pulling institutional money even as other leading tokens continue to struggle.
On June 26, SoSoValue data showed XRP spot ETFs attracted about $15,6 million (approx. R 267,6 million) in net inflows, leading all cryptocurrency exchange traded funds for the day.
During the same session, spot Bitcoin ETFs recorded about $444,5 million (approx. R 7,6 billion) in net outflows, while Ethereum funds lost roughly $12,9 million (approx. R 220 million).
The buying trend has extended beyond a single session. According to SoSoValue, XRP spot ETFs have now logged seven consecutive weeks of positive flows, bringing cumulative inflows over that period to approximately $144,7 million (approx. R 2,5 billion).
By comparison, Bitcoin ETFs have seen around $7,7 billion (approx. R 132,3 billion) leave the market over the same seven-week stretch, while Ethereum ETFs have recorded roughly $1,2 billion (approx. R 20,2 billion) in net outflows.
Network activity on XRP has also surged against this backdrop.
According to crypto analyst Ali Charts, the daily active XRP addresses increased from around 23,000 on June 14 to almost 39,500 over the subsequent two weeks.
Network activity on $XRP has surged over the past two weeks.
— Ali Charts (@alicharts) June 28, 2026
Daily active addresses have climbed from 23,000 on June 14 to nearly 39,500 today, signaling growing on-chain participation. pic.twitter.com/lqX9oo3AsS
Higher active address counts generally indicate more users interacting with the blockchain.
While the data does not confirm that prices will recover, it has coincided with XRP testing one of its most closely watched support levels.
XRP price analysis
Technical indicators, in the meantime, highlight that XRP remains under pressure even as selling momentum has eased.
On the daily chart, XRP continues trading below its 20, 50, 100 and 200 day exponential moving averages, confirming that sellers still control the broader trend.
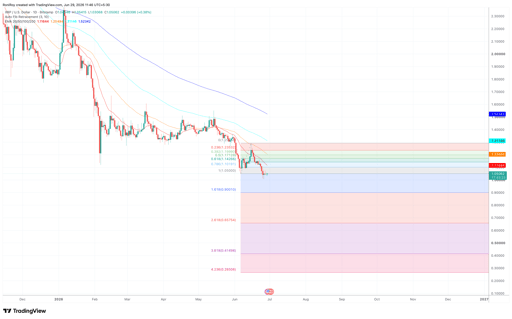
XRP/USD 1-day price chart. Source: TradingView.
The token has also held near the 100% Fibonacci retracement level around $1.05 after declining from its recent swing high.
The current setup places immediate resistance around $1.10, followed by the 61.8% Fibonacci retracement near $1.14 and the 50% retracement around $1.17.
The 50-day EMA near $1.20 and the 100-day EMA around $1.31 create another resistance zone that buyers would likely need to reclaim before sentiment improves.
Meanwhile, the 4-hour chart shows XRP consolidating between roughly $1.03 and $1.06 after several sessions of sideways trading.
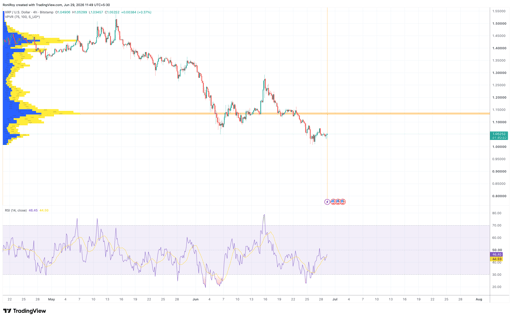
XRP/USD 4-hour price chart. Source: TradingView.
Volume Profile Visible Range data identifies the $1.13 to $1.15 area as a high volume node where significant trading previously occurred, making it an important resistance level after the recent breakdown.
The 4 hour relative strength index has also recovered to around 46 after previously approaching oversold territory, indicating selling pressure has weakened even though momentum remains below the neutral 50 level.
Derivatives positioning has also changed over the past week.
According to a CryptoQuant analysis, XRP futures markets have undergone a broad deleveraging phase after long liquidations surged to nearly $3 million (approx. R 51,4 million), representing an increase of more than 800% compared with the previous month.
Data from the analysis also showed open interest falling from about $1,2 billion (approx. R 20,2 billion) to nearly $1 billion (approx. R 17,8 billion), while funding rates turned sharply negative as leveraged bullish positions were forced out of the market.
Such conditions often remove excessive leverage before the market establishes its next directional move, although the analysis did not suggest that a reversal was guaranteed.
At the same time, it noted that spot market behaviour has remained comparatively stable.
Binance reserve balances changed little during the week, indicating holders have not moved large amounts of XRP onto the exchange for immediate selling.
For now, the $1 level remains the main support that traders are watching.
Holding above it could allow XRP to challenge resistance between $1.10 and $1.15 before testing the broader resistance cluster around $1.20 to $1.31.
A sustained break below $1, however, would expose the next technical support near $0.90, while $0.85 and $0.70 remains as additional downside levels if selling pressure accelerates.

JTO price prediction as Jito launches JTX self-custodial trading platform

Zcash price prediction: Can ZEC break above $562 after the Ironwood upgrade?

SUI price prediction: Bullish accumulation signals build

Interview: Agentic AI to drive blockchain adoption, says Animoca Brands' Evan Auyang

ONDO price jumps 13%: can DTCC link drive a bigger breakout?
No results found
Loading articles...
Failed to load articles. Please try again.