Solana breaks above $80 as institutional push lights up SOL rally

AI Sentiment: 82/100 Bullish
This score is generated through AI-driven analysis of the article's content.
powered by
Buy SOL. It reclaimed key moving averages (20/50-day) and is now testing the 100-day EMA (~$81.6) after breaking back above $80. Institutional catalysts (tokenized equities via Securitize/SECZ and rising spot Solana ETF AUM) plus higher network activity (near 1B tx/week, daily launches up) support follow-through. Long-short ratio rising also signals traders expect continuation. If SOL holds the $80–$82 high-volume node, momentum can carry it toward the 200-day EMA near ~$96.8.
Key Risk: A sharp risk-off crypto selloff that breaks $80 and turns the breakout into a failed rally.
Buy SECZ. The news is a direct, regulated on-chain equity product launch tied to Solana’s ecosystem and NYSE debut. That creates a “real-money” demand channel for Solana-linked assets beyond pure trading hype. If SOL keeps trending higher, SECZ should benefit from increased attention and liquidity as eligible investors rotate into the new tokenized exposure.
Key Risk: Regulatory/market access friction (eligibility limits, trading restrictions, or liquidity drying up) that prevents SECZ from attracting sustained buyers.
- Solana reclaimed $80 as ecosystem momentum strengthened.
- ETF growth and network activity fueled buying interest.
- Technical indicators suggest SOL could extend gains.
Solana has climbed back above $80 for the first time since early June after a series of ecosystem-specific developments fueled fresh buying interest throughout the week.
According to CoinGecko data, Solana SOL traded around $81.12 on July 3 after gaining more than 18% over the past seven days.
The rally pushed the token above the psychologically important $80 level, with the price briefly touching above $82 before settling into a narrow range.
The recovery came as several ecosystem developments coincided with stronger institutional participation and rising network activity.
Institutional adoption and ecosystem growth support recovery
One of the week's biggest institutional developments came on July 2 when Securitize tokenized its own public common stock on Solana and Avalanche alongside its New York Stock Exchange debut through a SPAC merger.
Approximately $295 million (approx. R 5,1 billion) worth of registered shares under the ticker SECZ are now available as regulated on-chain tokens for eligible US investors.
Assets under management in spot Solana ETFs have also surpassed $1 billion (approx. R 17,1 billion) this week.
Simultaneously, Solana’s long-short-ratio also hit its highest level over a month, according to Coinglass data.
This means that traders were increasingly betting that Solana's rally would continue.
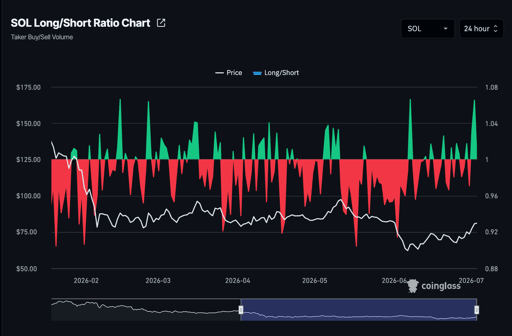
Solana long-short ratio. Source: Coinglass.
Within the ecosystem itself, Phantom rolled out native support for the Solana-native World prediction market protocol on July 1.
The integration allows the wallet's 20 million users to access non-custodial event contracts, adding another consumer-facing application that reinforces confidence in Solana's growing ecosystem.
Against this backdrop, Dune Analytics data shows that the Solana network has processed nearly 1 billion transactions during the past week, while daily token launches climbed to their highest level in roughly 80 days on July 1.
Much of the network activity was centered around ANSEM, a highly capitalised new meme coin which reached a $170 million (approx. R 2,9 billion) market capitalisation.
Solana price analysis
The positive fundamental backdrop has coincided with a noticeable improvement in Solana's technical structure.
On the daily chart, SOL has reclaimed both its 20-day and 50-day exponential moving averages, which sit near $73.76 and $75.66, respectively, after spending several weeks below them.
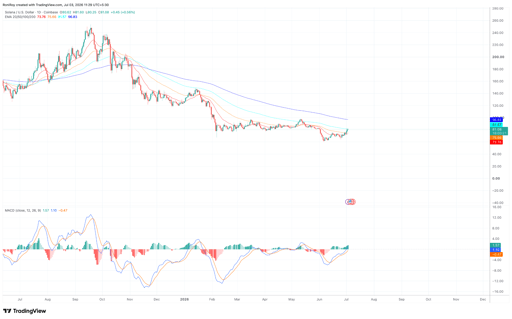
SOL/USD 1-day price chart. Source: TradingView.
Price is now testing the 100-day EMA around $81.57, making that level the first major technical hurdle.
A successful move above it could strengthen the case for an advance toward the 200-day EMA near $96.83, which remains the next significant resistance on the higher timeframe.
Momentum indicators have also turned more constructive.
The daily MACD has completed a bullish crossover above its signal line, while the histogram has shifted into positive territory, indicating buying momentum has strengthened after the June recovery.
The relative strength index has climbed to around 64, placing it comfortably above the neutral 50 level without entering overbought territory above 70.
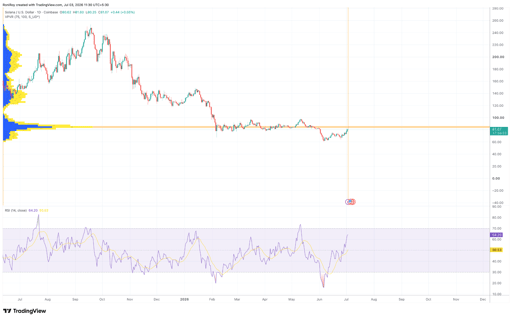
SOL/USD 1-day price chart. Source: TradingView.
This suggests buyers still have room to extend the rally if demand remains steady.
SOL is currently trading around a major high-volume node near the $80 to $82 region, an area where substantial trading activity previously took place.
Holding above this zone would reinforce it as support, while a sustained breakout could open the way toward the mid-$90s where the 200-day EMA currently sits.
On the downside, losing this level could bring the 100-day, 50-day, and 20-day moving averages back into focus as successive support levels.

Bitcoin price forecast: did BTC just flash its strongest bottom signal yet?

Strategy stock jumps as analysts back new capital plan

Fhenix acquires Sunscreen, appoints Founder to lead privacy research

Ethereum climbs back above $1,600, but can the rebound keep going?

Pi Network price crashes to record low: Can it rebound in H2?
No results found
Loading articles...
Failed to load articles. Please try again.