
Bitcoin Cash price outlook: BCH tracks BTC Higher, but can the rally continue?

AI Sentiment: 68/100 Bullish
This score is generated through AI-driven analysis of the article's content.

powered by

Buy Bitcoin Cash (BCH) around $232.30–$233.00, adding only if it holds above the $232.70 high-volume Point of Control and stays above the 7-day SMA (~$235.13). Upside targets: $238.25 then $241.00; momentum continuation could extend toward $246.53. Thesis: BCH’s strength is currently being supported by buyers defending the $230–$233 demand zone, not just a one-day BTC bounce.
Key Risk: BCH closes below $230.60, breaking the bullish structure and triggering a move toward ~$223.32.
Buy BCH as a higher-beta way to express BTC strength: if BTC keeps grinding higher, BCH should outperform while it remains above $233.30. Use a tight invalidation: exit on a daily close below $230.60. Targets: $238.25 first, then $241.00. Thesis: the rally is BTC-led, and BCH is still positioned to catch the next leg as long as its key support holds.
Key Risk: BTC reverses sharply and drags BCH through $230–$233 support.
- BCH has gained 1.5% as it closely followed Bitcoin's upward move.
- Strong support remains between $230 and $233.
- A break above $241 could open the path toward $246.
Bitcoin Cash BCH traded at $236.38 at the time of writing, posting a 1.5% gain over the past 24 hours.
The move comes as the broader cryptocurrency market recorded modest gains, with Bitcoin (BTC) also moving higher during the same period.
While BCH has outperformed the wider market slightly, recent price action suggests that the rally has largely been driven by Bitcoin's strength rather than a catalyst specific to Bitcoin Cash.
The latest data shows BCH trading within a 24-hour range of $230.10 to $240.28, keeping the asset above an important support zone that traders have been watching closely.
Over a longer timeframe, Bitcoin Cash has gained 8.3% in the past seven days, 21.7% over the last 14 days, and 14% during the past month.
BCH holds above a key support zone
Recent technical analysis by crypto analyst KryptoKD identified the area around $232.70 as the current Point of Control (POC), the price level where the highest trading volume occurred during the recent range.
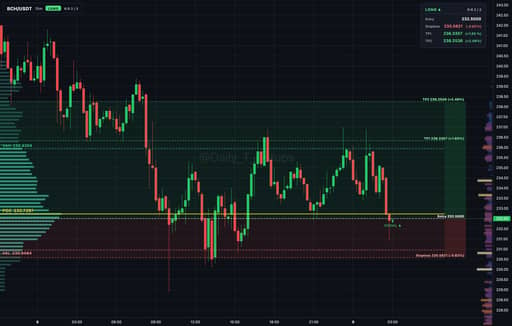
According to the analysis, bulls have repeatedly stepped in near this level, preventing the market from slipping into a deeper correction.
The analyst outlined two possible entry approaches.
A conservative strategy would require confirmation above $233.00-$233.30 alongside improving bullish momentum, while a more aggressive approach would involve scaling into positions between $232.30 and $232.70 as long as the support continues to hold.
The first upside target identified in the analysis stood at $236.35, a level that has already been reached with BCH trading around $236.38.
Attention now shifts to the next resistance levels at $238.25 and $241.00, which could come into focus if buyers maintain control above the current support zone.
On the downside, the setup would lose its bullish structure if BCH closes below $230.60. Such a move would suggest that sellers have regained control and could open the door for additional downside pressure.
Key Bitcoin Cash price levels to watch
From a technical perspective, Bitcoin Cash remains above its 7-day Simple Moving Average of $235.13, keeping the short-term structure constructive.
Immediate support is found near the 23.6% Fibonacci retracement level at $233.26, which closely aligns with KryptoKD's identified Point of Control around $232.70.
The overlap between these technical indicators makes the $230-$233 region one of the most important areas on the chart.
If bulls continue defending this zone, attention could shift toward $238.25, followed by $241.00.
A stronger continuation could eventually bring $246.53 into view, which represents another notable resistance level identified by market participants.
However, if BCH falls below the $230-$233 support area, the next significant technical level sits near the 38.2% Fibonacci retracement at $223.32.
A break toward that level would indicate that the recent bullish momentum has weakened after failing to hold above high-volume support.

Why is XRP falling even as ETF money keeps flowing into the market?

Why is Ethereum stuck below $2,500 even as ETF inflows stay strong?

Is Bitcoin’s $80,000 wall about to crack, or are whales ready to sell?

Bitcoin holds near $80K as Fed hike bets rise, ETF inflows continue

Solana targets $120 as ETF inflows and network activity rise
No results found
Loading articles...
Failed to load articles. Please try again.