
Figma stock forms a rare double-bottom pattern: is a rebound coming?

AI Sentiment: 78/100 Bullish
This score is generated through AI-driven analysis of the article's content.

powered by

Buy FIGMA. The stock has formed a double-bottom near $16.80, reclaimed the 50-day EMA, and RSI is back to 61—classic setup for a move toward the $27.80 neckline, with upside to ~$31.25 if it breaks. Fundamental support: Q1 revenue +46% to $333.4M, guidance for Q2 $348–$350M (+40% YoY), and management conservatism suggests upside to revenue.
Key Risk: Earnings/guidance disappoint and the chart breaks back below the $16.80–$20 support, turning the double-bottom into a failed pattern.
Buy FIGMA and sell short a weaker software peer basket (e.g., short ATVI?—no; use Adobe (ADBE) or ServiceNow (NOW) as the short). The news is that Figma is growing through the “SaaS apocalypse” narrative, so investors rotate back into durable growth names. FIGMA’s paid-seat growth and hyperscaler expansion should drive a relative re-rating versus peers that are more exposed to multiple compression and slower growth fears.
Key Risk: The market decides the rebound is purely technical and re-rates the whole group down anyway (rates/macro hit), so FIGMA doesn’t outperform on a relative basis.
- Figma stock has formed a double-bottom pattern on the daily chart.
- These technicals suggest that it has more upside in the near term.
- The company’s business is growing despite the SaaSpocalypse fears.
Figma stock has staged a modest comeback in the past few days, moving from a record low of $16.80 to the current $23.65.
This rebound may continue in the coming weeks after the stock formed a double-bottom pattern and as its earnings report looms.
Figma stock technical analysis points to more gains
The daily chart shows that Figma’s tide is turning after months of falling. It formed a double-bottom pattern at $16.80, its lowest level in April and June this year. Its neckline was at $27.80, its highest point on June 1 this year.
The stock has now moved above the 50-day Exponential Moving Average (EMA), while the Relative Strength Index (RSI) has jumped to 61 from the year-to-date low of 17.83.
Therefore, the stock will likely continue rising in the near term, potentially to the key resistance at $27.80.
A move above that level will point to more gains, potentially to the Ultimate Resistance of the Murrey Math Lines of $31.25, which is about 35% above the current level.
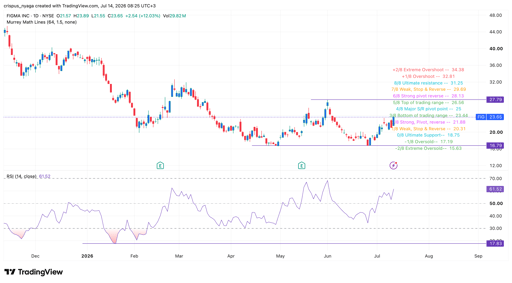
Figma Inc. stock chart | Source: TradingView
Figma’s business is thriving despite the SaaSPocalypse fears
Figma is a top player in the software industry, where it offers a platform that simplifies how companies design. It is used widely by companies of all sizes, including giants like Google, Airbnb, Atlassian, Microsoft, GitHub, and Duolingo.
Its stock initially jumped after its IPO last year and then started a strong downward trend, reaching a record low this year.
This retreat happened as investors dumped software companies in a process that has become known as the SaaSApocalypse. Other top software companies like Atlassian, Adobe, Autodesk, and ServiceNow have plunged.
In reality, however, Figma’s business has continued to grow as more companies have embraced its solution.
Its last financial results showed that its revenue jumped by 46% in Q1 to $333.4 million, higher than its previous guidance.
The company’s results showed that its business continued to attract clients despite the AI disruption. The number of companies paying over $10,000 jumped to 15,218 from 11,107 in the same period last year.
Those paying $100,000 and above jumped to 1,525 from 1,031. Notably, the company received an order from one hyperscaler that added 35,000 paid seats during the quarter.
Instead of being disrupted by AI, the company is using this technology to improve and monetize its solution. For example, it started to implement AI credit limits for all its customers in March, without experiencing any significant churn.
The management team expects that the upcoming earnings report will show that its business continued growing in Q2.
Its guidance is that its revenue will be between $348 million and $350 million, up by 40% YoY.
It expects its annual revenue to be between $1.422 billion and $1.428 billion, representing a 35% YoY growth. The real figure will likely be higher than that, as the management tends to be highly conservative.
Most analysts have a price target that is higher than the current one. Bank of America analysts have a target of $30, while Wells Fargo’s Michael Turrin has a target of $36.
Piper Sandler, Citigroup, and JPMorgan analysts have targets of above $30.
Figma does have some challenges. For example, competition continues to rise, with companies like Sketch and Adobe being major ones.
Also, it is still losing money, with its loss from operations rising to $137 million in the first quarter. Its valuation is still high, with its forward price-to-sales ratio rising to 7.7.

Micron, Nvidia, AMD stocks at risk as Anthropic, OpenAI leads push to slow AI growth

How will private credit and equity stocks react to Fed rate hikes?

WTI crude oil price forecast as Middle East risks remain elevated: can it hit $120?

Top crypto price predictions today: Pi Network, Pepe Coin, Zcash

Why SpaceX stock is up around 1% on Friday
No results found
Loading articles...
Failed to load articles. Please try again.