
Dogecoin nears yearly low: is a brutal drop below $0.069 coming?

AI Sentiment: 18/100 Bearish
This score is generated through AI-driven analysis of the article's content.

powered by

Go long Bitcoin (BTC) or Ethereum (ETH) and short DOGE (pair trade). The news says institutional demand is weak for DOGE (spot DOGE ETF inflows minimal) while the broader crypto market is only mildly supported by macro risk. If the market stabilizes, DOGE typically underperforms first; if it sells off, DOGE likely falls harder—either way, relative value favors BTC/ETH over DOGE.
Key Risk: DOGE catches a meme-driven bid and outperforms BTC/ETH sharply, driven by viral retail inflows.
Short Dogecoin (DOGE) outright or via DOGE perpetuals while it’s below the 50/100/200-day EMAs ($0.081/$0.088/$0.104). The article flags negative funding (-0.003%) and a long-to-short ratio of 0.82, showing traders are already leaning bearish. With RSI ~39 (not fully oversold) and price pressing yearly-low support, a break below $0.069 should accelerate selling toward $0.065.
Key Risk: DOGE reclaims the 50-day EMA (~$0.081) and holds, flipping sentiment and forcing shorts to cover.
- Dogecoin (DOGE) remains under pressure on Friday, trading near its yearly low.
- Negative funding rates and a falling long-to-short ratio suggest further price dip.
- A break below $0.069 could send Dogecoin toward the $0.065 support level.
Dogecoin DOGE continued its downward trend on Friday, trading around $0.071 and hovering close to its yearly low as weak market sentiment and deteriorating derivatives data weighed on the leading meme coin.
With traders increasingly positioning for further losses and institutional demand remaining subdued, DOGE's technical outlook suggests the correction could continue if key support levels fail to hold.
Bearish derivatives data weighs on DOGE
Market positioning has become increasingly negative, according to data from CoinGlass.
DOGE's long-to-short ratio fell to 0.82 on Friday, approaching its lowest level in more than a month.
A ratio below 1.0 indicates that short positions outnumber long positions, reflecting growing expectations that the price will continue to decline.
Adding to the bearish outlook, funding rates turned negative at -0.003%, signaling that short sellers are paying long traders to maintain their positions—a common indication of weakening market sentiment.
Data from SoSoValue also highlights a lack of institutional participation.
Spot Dogecoin ETFs have recorded little meaningful activity over the past two weeks, with limited inflows providing no significant support for the token during its recent decline.
The absence of fresh institutional buying leaves DOGE more vulnerable to continued selling pressure from retail traders.
Dogecoin’s technical outlook remains bearish
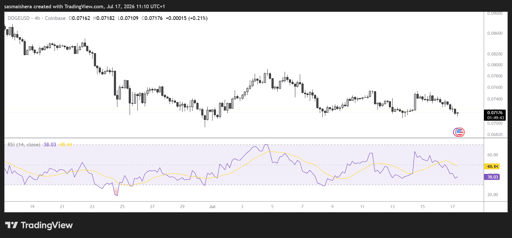
Similar to other leading memecoins, the DOGE/USD 4-hour chart is currently bearish and efficient.
From a technical perspective, Dogecoin continues to trade well below its key moving averages, reinforcing the prevailing downtrend.
At press time, DOGE remains below the 50-day Exponential Moving Average (EMA) at $0.081, the 100-day EMA ($0.088), and the 200-day EMA ($0.104)
This cluster of resistance levels suggests that any short-term rebound could face significant selling pressure.
Technical momentum indicators continue to favor the bears. The Relative Strength Index (RSI) is hovering near 39, indicating weak momentum while remaining just above oversold territory.
This suggests there is still room for additional downside before buyers may begin stepping in.
Meanwhile, the Moving Average Convergence Divergence (MACD) remains slightly above the zero line, indicating that bearish momentum is developing gradually rather than accelerating into a sharp sell-off.
If the bulls regain control, the immediate resistance level sits at $0.079, followed by the 50-day EMA at $0.081.
A stronger recovery would need to clear the broader resistance zone around $0.088–$0.089, where horizontal resistance and a descending trendline converge.
However, if the bearish trend persists, $0.069 remains the most critical support level after marking DOGE's yearly low.
A daily close below that level could trigger another wave of selling, exposing the next key psychological support around $0.065.
Currently, the broader cryptocurrency market is underperforming due to the ongoing tensions in the Middle East.
Until buying activity strengthens and DOGE reclaims its major moving averages, the broader technical outlook remains tilted in favor of the bears.

Can ARB price reach $0.14 after 30% rally powered by Robinhood chain?

BONK jumps 7% as rising futures demand supports a breakout attempt

Robinhood stock rises as Morgan Stanley upgrades HOOD to overweight

XRP price slips despite 10-day ETF inflow streak: is a breakout still coming?

Bitcoin price rises, but why is $80K proving so hard to break?
No results found
Loading articles...
Failed to load articles. Please try again.